Fig. 2
Download original image
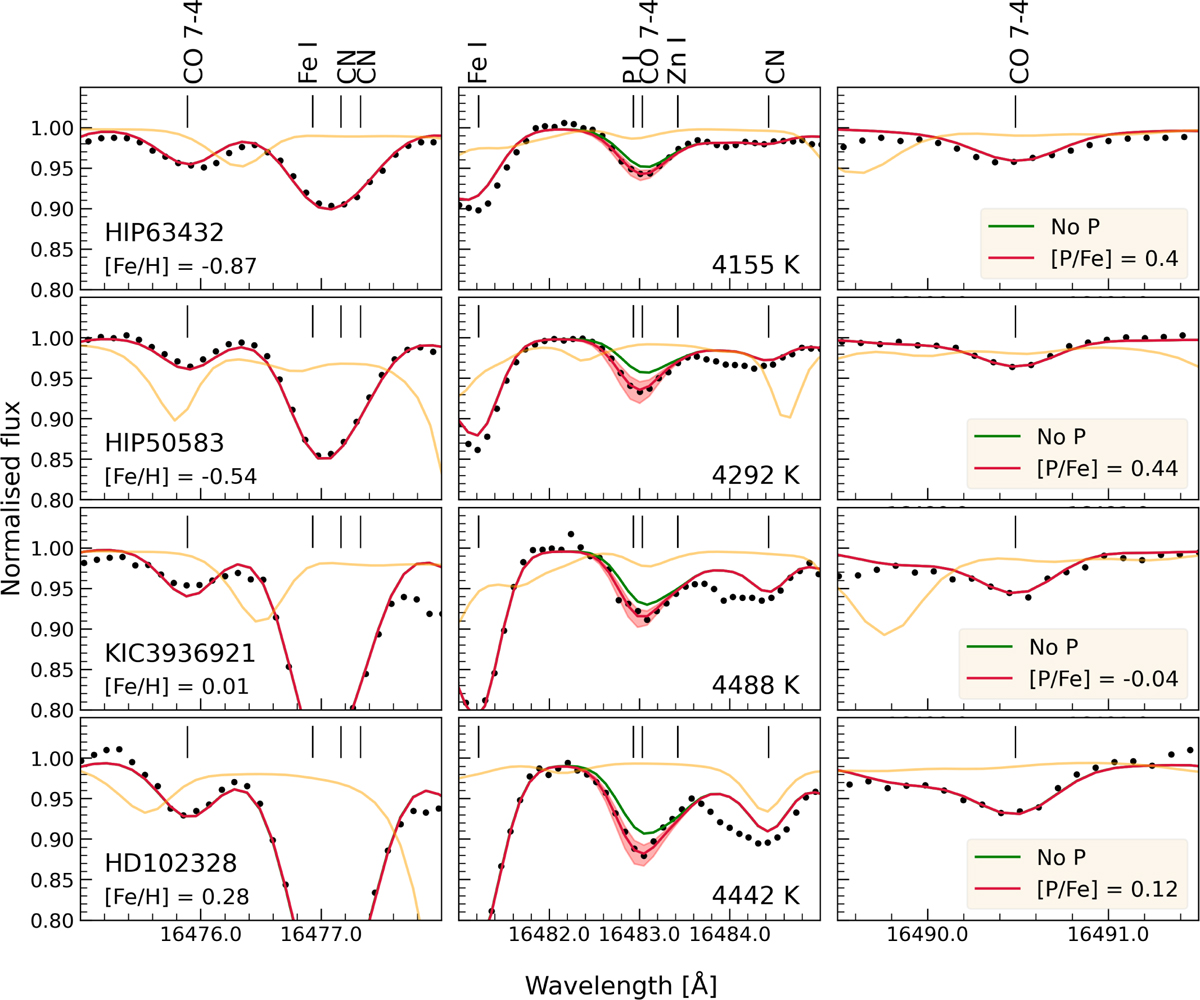
Fits (red line) to the observed spectra (black points) for four stars chosen to represent the typical spectrum at metallicities of −0.87 dex (HIP63432), −0.54 dex (HIP50583), 0.01 dex (KIC3936921), and 0.28 dex (HD 102328). Each row represents one star with stars arranged in the order of increasing metallicity from top to bottom. The segment of the corresponding spectrum with the P line at 16482.92 Å is shown in the middle panel in each row. In the left and right panels, spectra of the neighboring CO(v = 7−4) lines are plotted. In each panel, the green line shows the synthetic spectrum without phosphorus or only showing the CO(v = 7−4) blend. The telluric spectrum used in the reduction is shown in yellow in order to indicate the pixels affected by telluric correction. The red band in the middle panel for the phosphorus line shows the variation of the synthetic spectrum with a Δ[P/Fe] = ±0.3 dex variation. The effective temperature, Teff, of each star is listed in the middle panels.
Current usage metrics show cumulative count of Article Views (full-text article views including HTML views, PDF and ePub downloads, according to the available data) and Abstracts Views on Vision4Press platform.
Data correspond to usage on the plateform after 2015. The current usage metrics is available 48-96 hours after online publication and is updated daily on week days.
Initial download of the metrics may take a while.