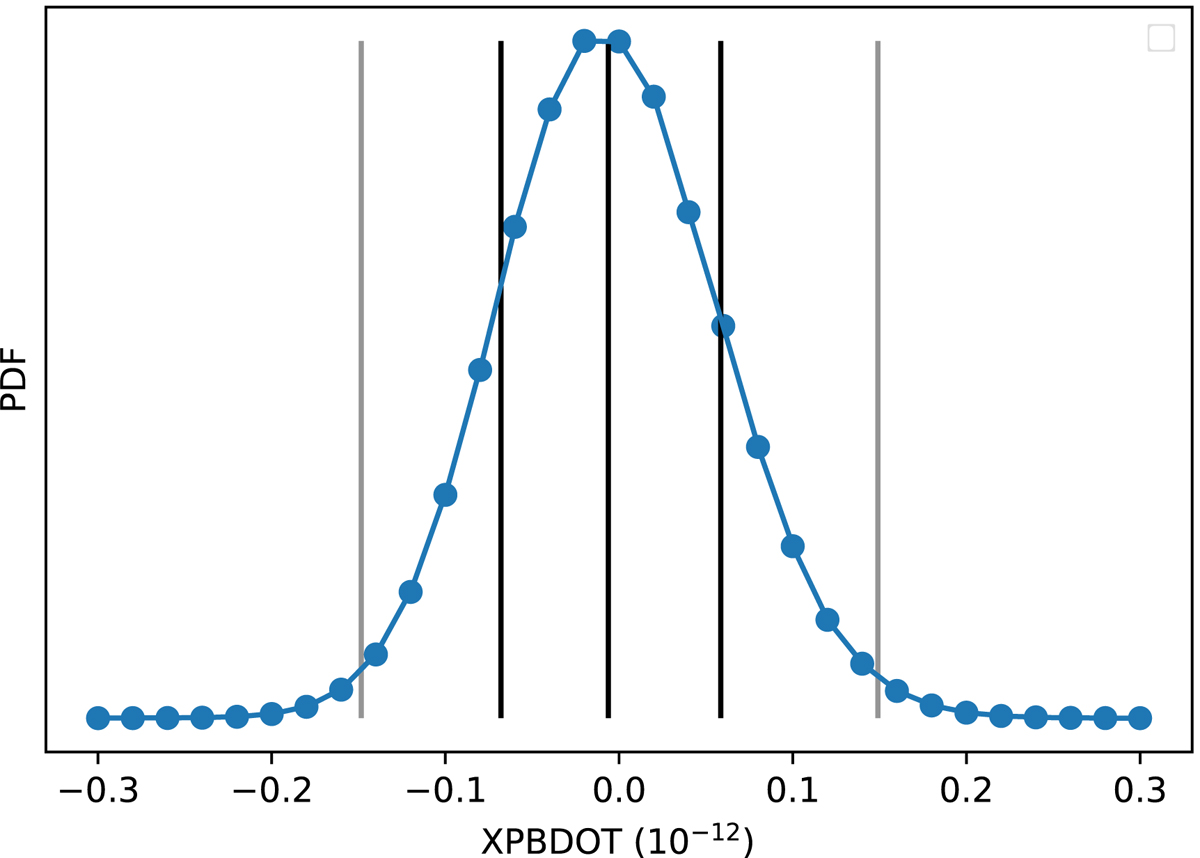
Fig. 5.
Download original image
1D probability density function of Ṗb,x derived from the best-fit χ2 of the DDGR solution. Blue dots represent the grid points over which the TEMPO fit was made, and the blue curve shows the interpolated function. The vertical black lines represent the median and 1σ values, and grey lines show the 2σ constraint. We obtain a 1σ estimate of Ṗb,x as ![]() .
.
Current usage metrics show cumulative count of Article Views (full-text article views including HTML views, PDF and ePub downloads, according to the available data) and Abstracts Views on Vision4Press platform.
Data correspond to usage on the plateform after 2015. The current usage metrics is available 48-96 hours after online publication and is updated daily on week days.
Initial download of the metrics may take a while.