Fig. 4.
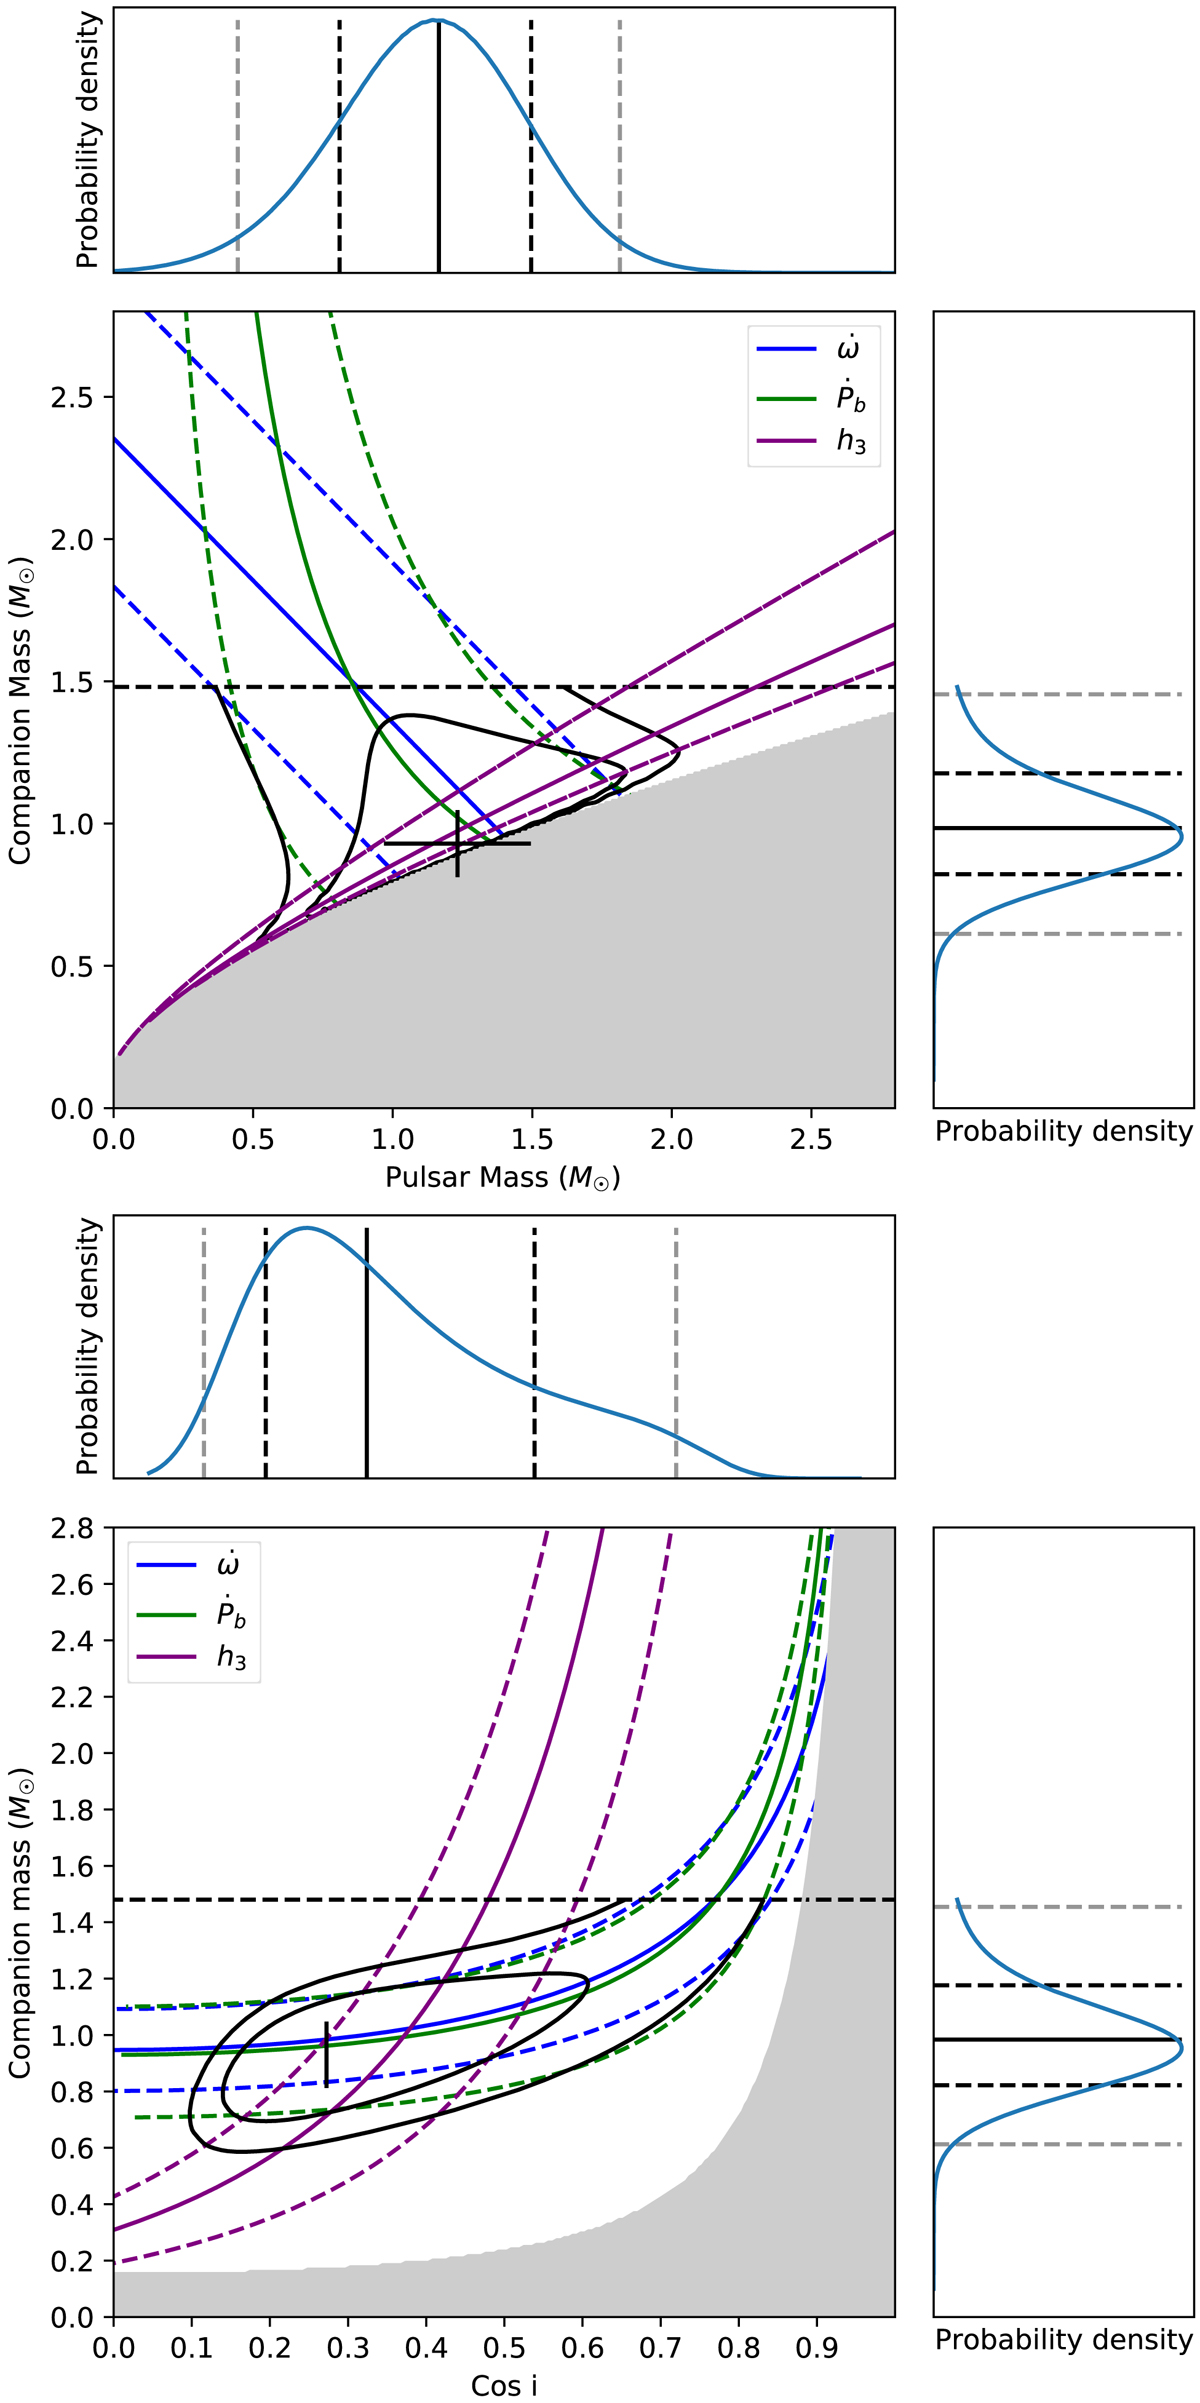
Download original image
Constraints on the Mc, Mp, and cos i derived from the measurement of three relativistic PK parameters are shown. The dashed black line shows the maximum Mc constraint of 1.48 M⊙. Coloured dashed lines depict the 1σ uncertainty on the measurements. Black contours show the likelihood or 2D PDFs at 68% (inner) and 95% (outer) confidence from the χ2 maps on cos i − Mc and Mp − Mc grids, derived from the DDGR fit. The corner plots represent the marginalised 1D PDFs of each of these measurements, and vertical lines in them mark the median, 1σ, and 2σ estimates. The black crosses indicate the best masses from the DDGR solution and the best inclination derived from the mass function using these masses.
Current usage metrics show cumulative count of Article Views (full-text article views including HTML views, PDF and ePub downloads, according to the available data) and Abstracts Views on Vision4Press platform.
Data correspond to usage on the plateform after 2015. The current usage metrics is available 48-96 hours after online publication and is updated daily on week days.
Initial download of the metrics may take a while.