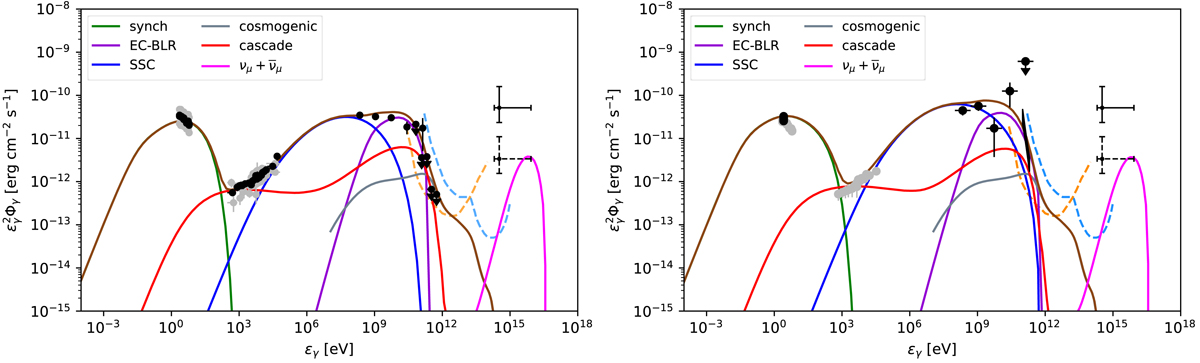
Fig. 1.
Download original image
Multiwavelength SED of TXS 0506+056 during the 2017–2019 campaign. Left: low-state (average) flux during the observation period. Black data points show the Fermi-LAT average spectrum and MAGIC upper limits, and Swift and NuSTAR spectra on 16 October 2018. Gray data points show the whole range of optical to X-ray spectra. Right: high-state observation in VHE γ-rays during December 2018. Black data points show the Fermi-LAT, MAGIC, and ASAS-SN contemporaneous spectra. Gray data points show the nearest observations in radio, optical, UV, and X-rays on 8 December 2018. The green, blue, and purple curves respectively correspond to SYN, SSC, and EC-BLR emissions. The red curve is the cascade emission from secondary electrons. The magenta curve is the predicted neutrino flux in both cases. The black solid and dashed PeV data points represent the IceCube flux upper limit for one detection in 0.5 yr and 7.5 yr respectively for the 2017 detection event. The gray line is the cosmogenic γ-ray flux from the extragalactic propagation of UHE protons. The orange and blue dashed lines are CTA and LHAASO point source sensitivity. See text for details.
Current usage metrics show cumulative count of Article Views (full-text article views including HTML views, PDF and ePub downloads, according to the available data) and Abstracts Views on Vision4Press platform.
Data correspond to usage on the plateform after 2015. The current usage metrics is available 48-96 hours after online publication and is updated daily on week days.
Initial download of the metrics may take a while.