Fig. 9.
Download original image
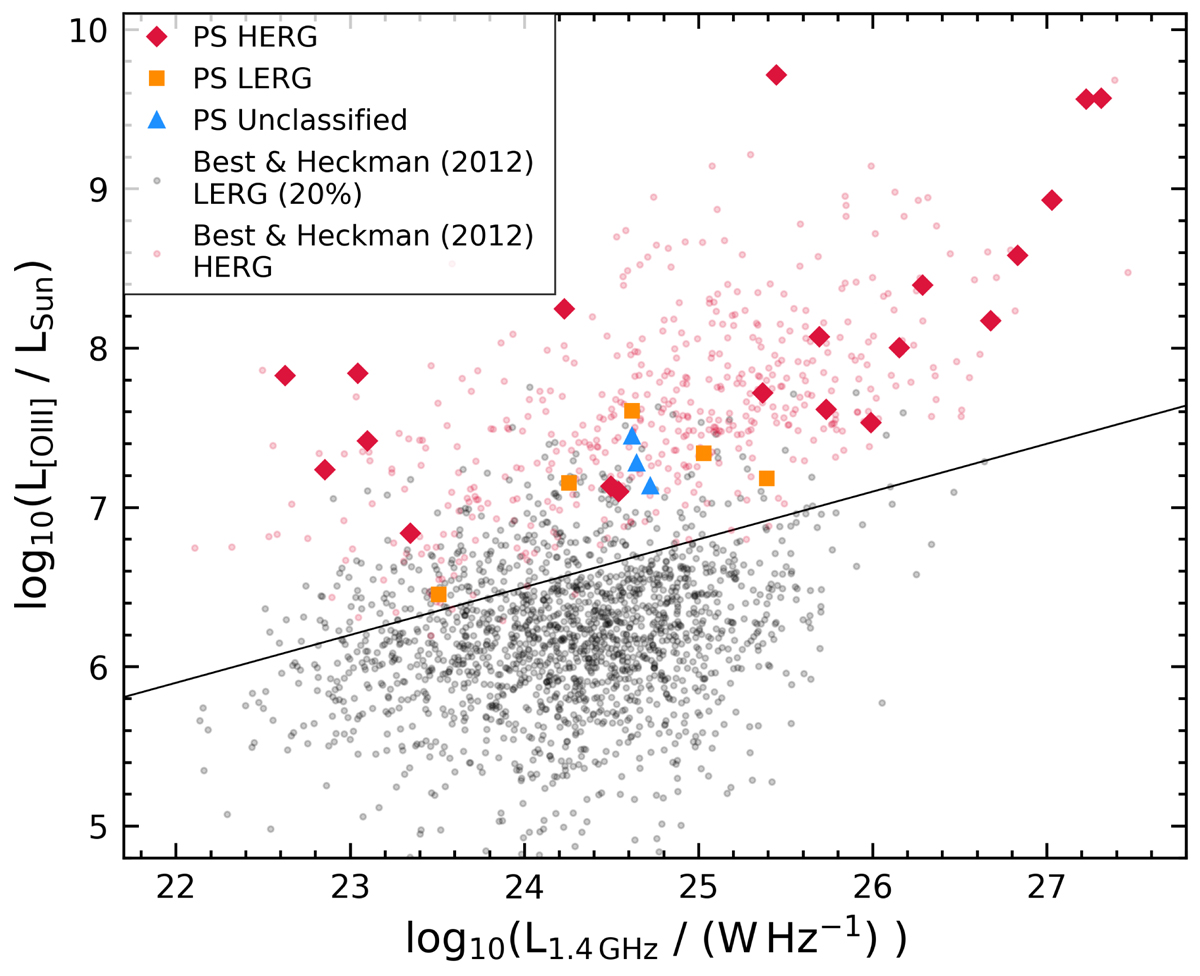
[O III] line luminosity vs 1.4 GHz radio luminosity of sources classified as HERGs and LERGs, and unclassified PS sources. The red diamonds, orange squares, and blue triangles indicate PS HERGs, PS LERGs and unclassified PS sources, respectively. The [O III] line luminosities vs 1.4 GHz radio luminosities of the sample of HERG and LERG sources presented by Best & Heckman (2012) are plotted as red and black points, respectively. In order to avoid overcrowding of the figure, only 20% of the LERGs in the Best & Heckman (2012) sample are plotted. The solid black line indicates the lower limit to the distribution of HERGs proposed by Best & Heckman (2012).
Current usage metrics show cumulative count of Article Views (full-text article views including HTML views, PDF and ePub downloads, according to the available data) and Abstracts Views on Vision4Press platform.
Data correspond to usage on the plateform after 2015. The current usage metrics is available 48-96 hours after online publication and is updated daily on week days.
Initial download of the metrics may take a while.