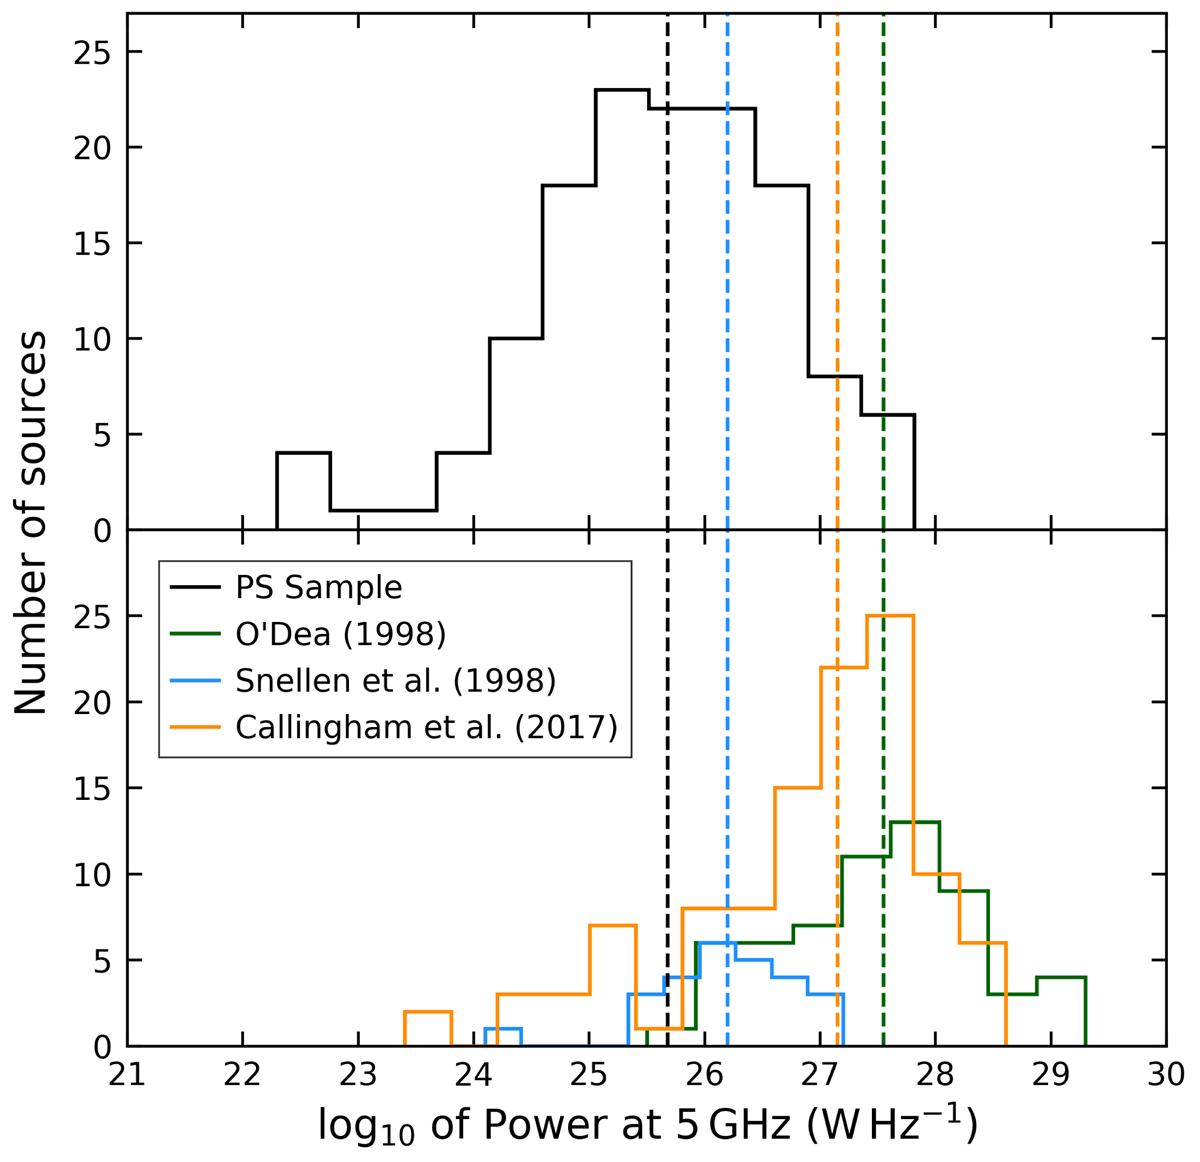
Fig. 7.
Download original image
Distribution of the 5 GHz radio power for different samples of PS samples. The distribution of the 5 GHz radio power for the 138 sources from the PS sample for which redshift data is available is shown in black (upper histogram). The green, blue, and orange histograms in the lower plot represent the 5 GHz radio power of the Snellen et al. (1998) PS sample, the O’Dea (1998) PS sample, and the Callingham et al. (2017) PS sample, respectively. The median redshifts of all distributions are plotted as dashed lines in their respective colours, in both the upper and lower plots. The median P5 GHz value and the range of the 16th and 84th percentiles of the distributions of the samples in this study, Snellen et al. (1998), O’Dea (1998), and Callingham et al. (2017), are given by ![]() ,
, ![]() ,
, ![]() , and
, and ![]() (log10 W Hz−1), respectively.
(log10 W Hz−1), respectively.
Current usage metrics show cumulative count of Article Views (full-text article views including HTML views, PDF and ePub downloads, according to the available data) and Abstracts Views on Vision4Press platform.
Data correspond to usage on the plateform after 2015. The current usage metrics is available 48-96 hours after online publication and is updated daily on week days.
Initial download of the metrics may take a while.