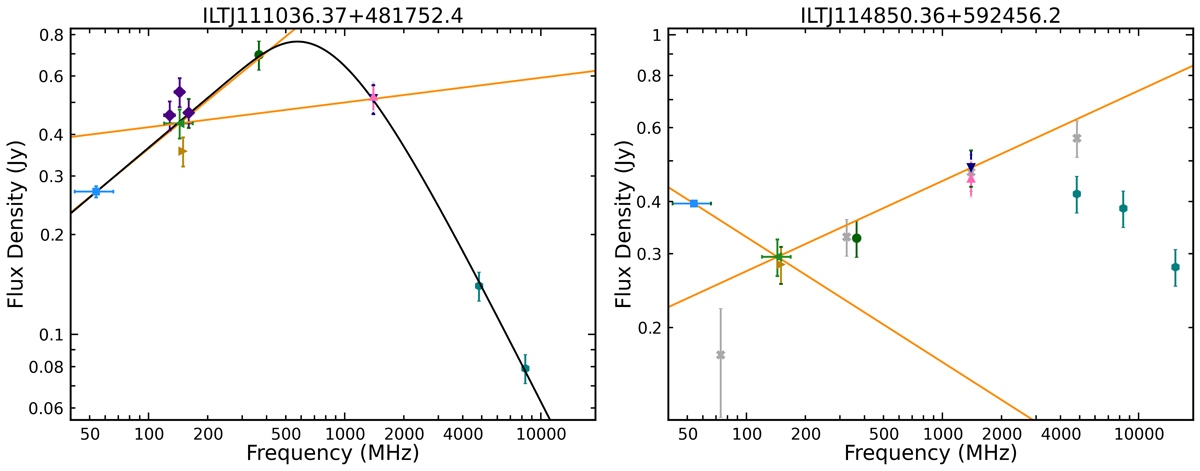
Fig. 5.
Download original image
Spectra of the two known GPS, CSO, and HFP sources in the Master sample. The symbols represent data from the same surveys as in Fig. 3. The grey crosses show the data presented by Marvil et al. (2015), the dark green circles the data from the TXS survey (Douglas et al. 1996), and the teal hexagons the data presented by Tremblay et al. (2016). The black curve in the left plot shows the generic curved model from Eq. (3).
Current usage metrics show cumulative count of Article Views (full-text article views including HTML views, PDF and ePub downloads, according to the available data) and Abstracts Views on Vision4Press platform.
Data correspond to usage on the plateform after 2015. The current usage metrics is available 48-96 hours after online publication and is updated daily on week days.
Initial download of the metrics may take a while.