Open Access
Fig. 4.
Download original image
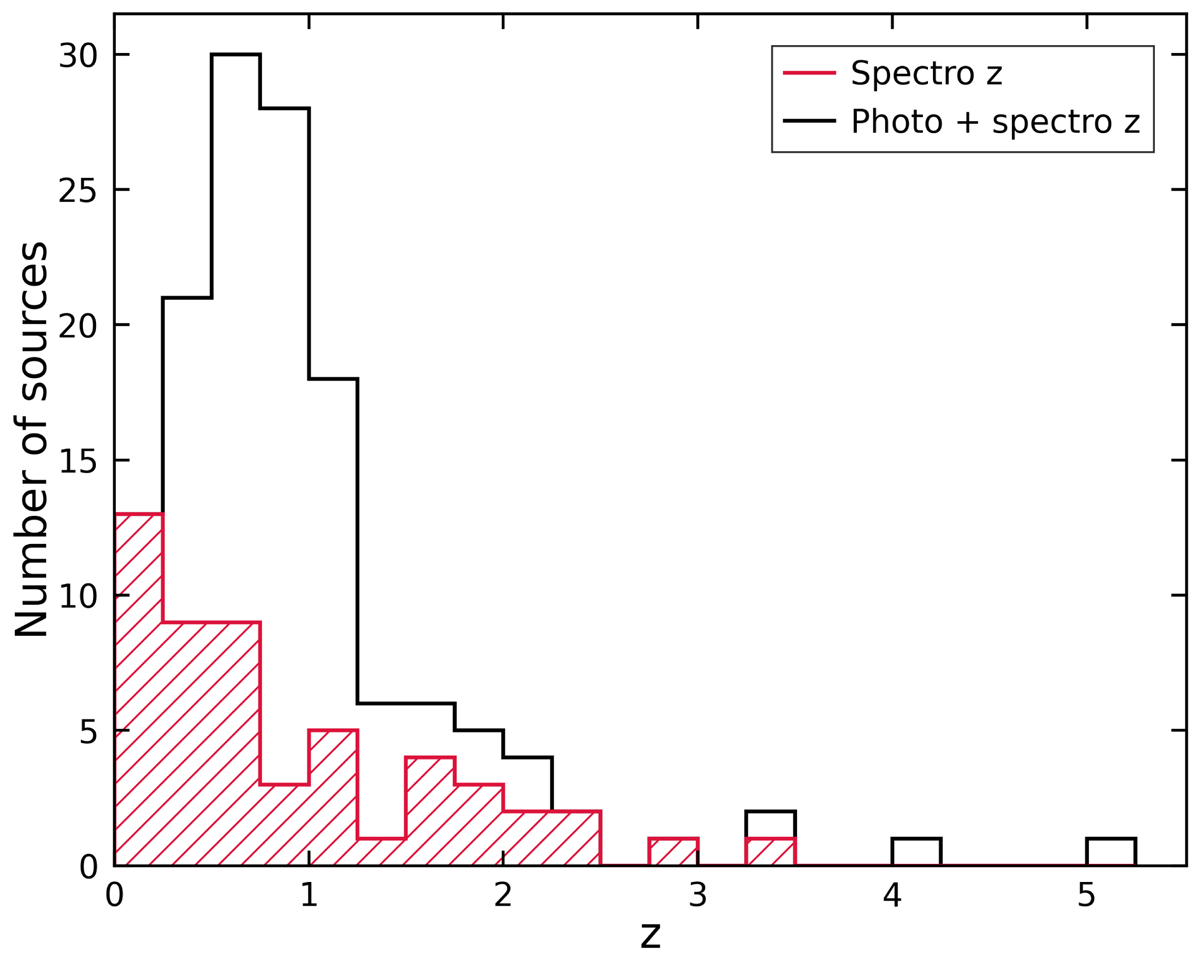
Redshift distribution of the 138 PS sources with available redshift data. The red histogram is the distribution of the spectroscopic redshifts available for 54 sources. The black histogram is the distribution of the best redshifts, from the combination of spectroscopic and photometric redshifts.
Current usage metrics show cumulative count of Article Views (full-text article views including HTML views, PDF and ePub downloads, according to the available data) and Abstracts Views on Vision4Press platform.
Data correspond to usage on the plateform after 2015. The current usage metrics is available 48-96 hours after online publication and is updated daily on week days.
Initial download of the metrics may take a while.