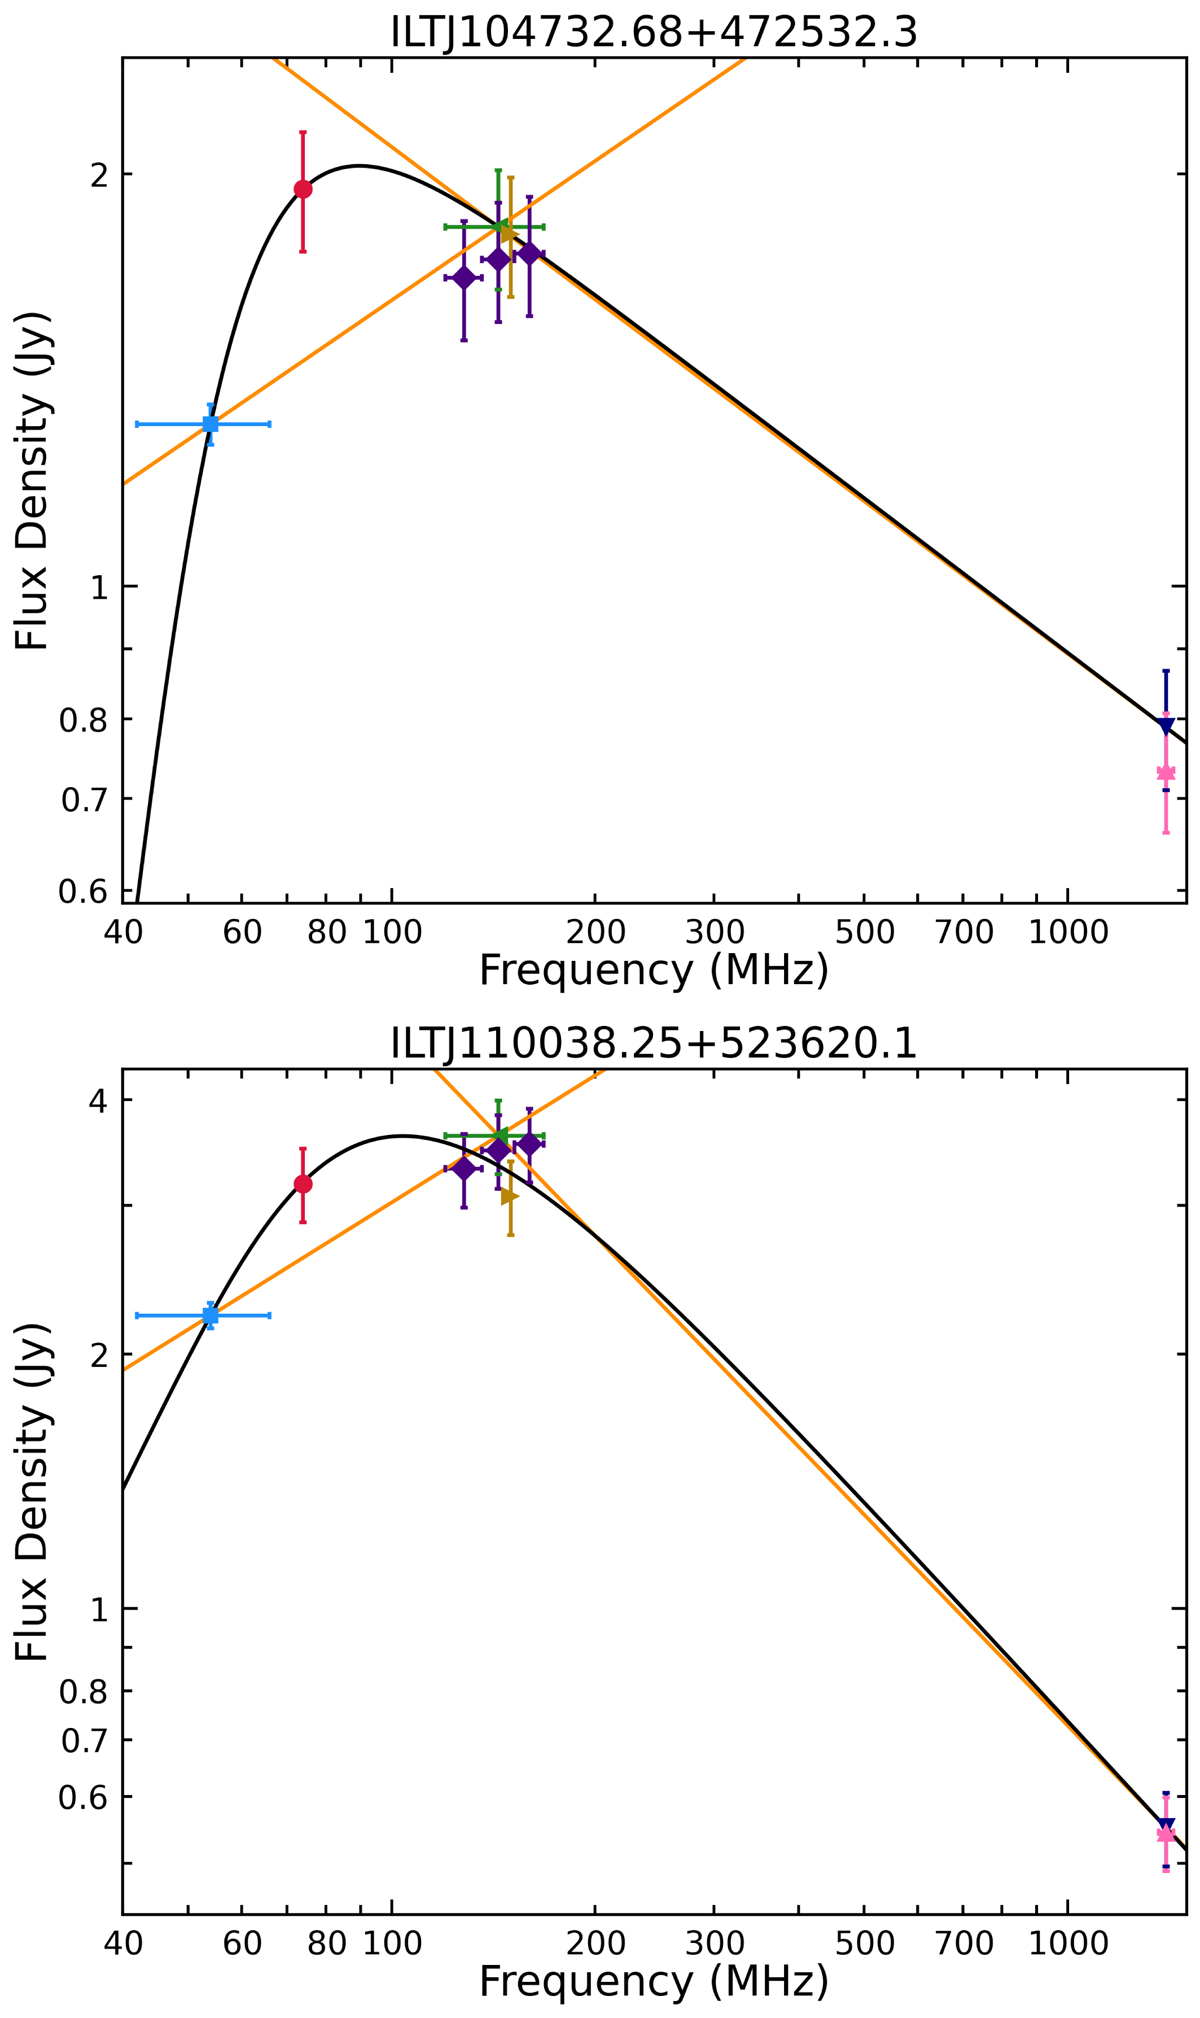
Fig. 3.
Download original image
Example spectra of a soft sample PS source (top) and a hard sample PS source (bottom). The flux densities of LoLSS (blue square), VLSSr (red circle), LoTSS-inband spectra (purple diamonds), LoTSS (green left-pointing triangle), TGSS (brown right-pointing triangle), NVSS (indigo downward-pointing triangle), and FIRST (pink upward-pointing triangle) are plotted where available. The black curve represents the generic curved model from Eq. (3), which was fitted to the LoLSS, LoTSS, VLSSr, TGSS, and NVSS data points. The power-law fits used to determine αlow and αhigh are shown in orange.
Current usage metrics show cumulative count of Article Views (full-text article views including HTML views, PDF and ePub downloads, according to the available data) and Abstracts Views on Vision4Press platform.
Data correspond to usage on the plateform after 2015. The current usage metrics is available 48-96 hours after online publication and is updated daily on week days.
Initial download of the metrics may take a while.