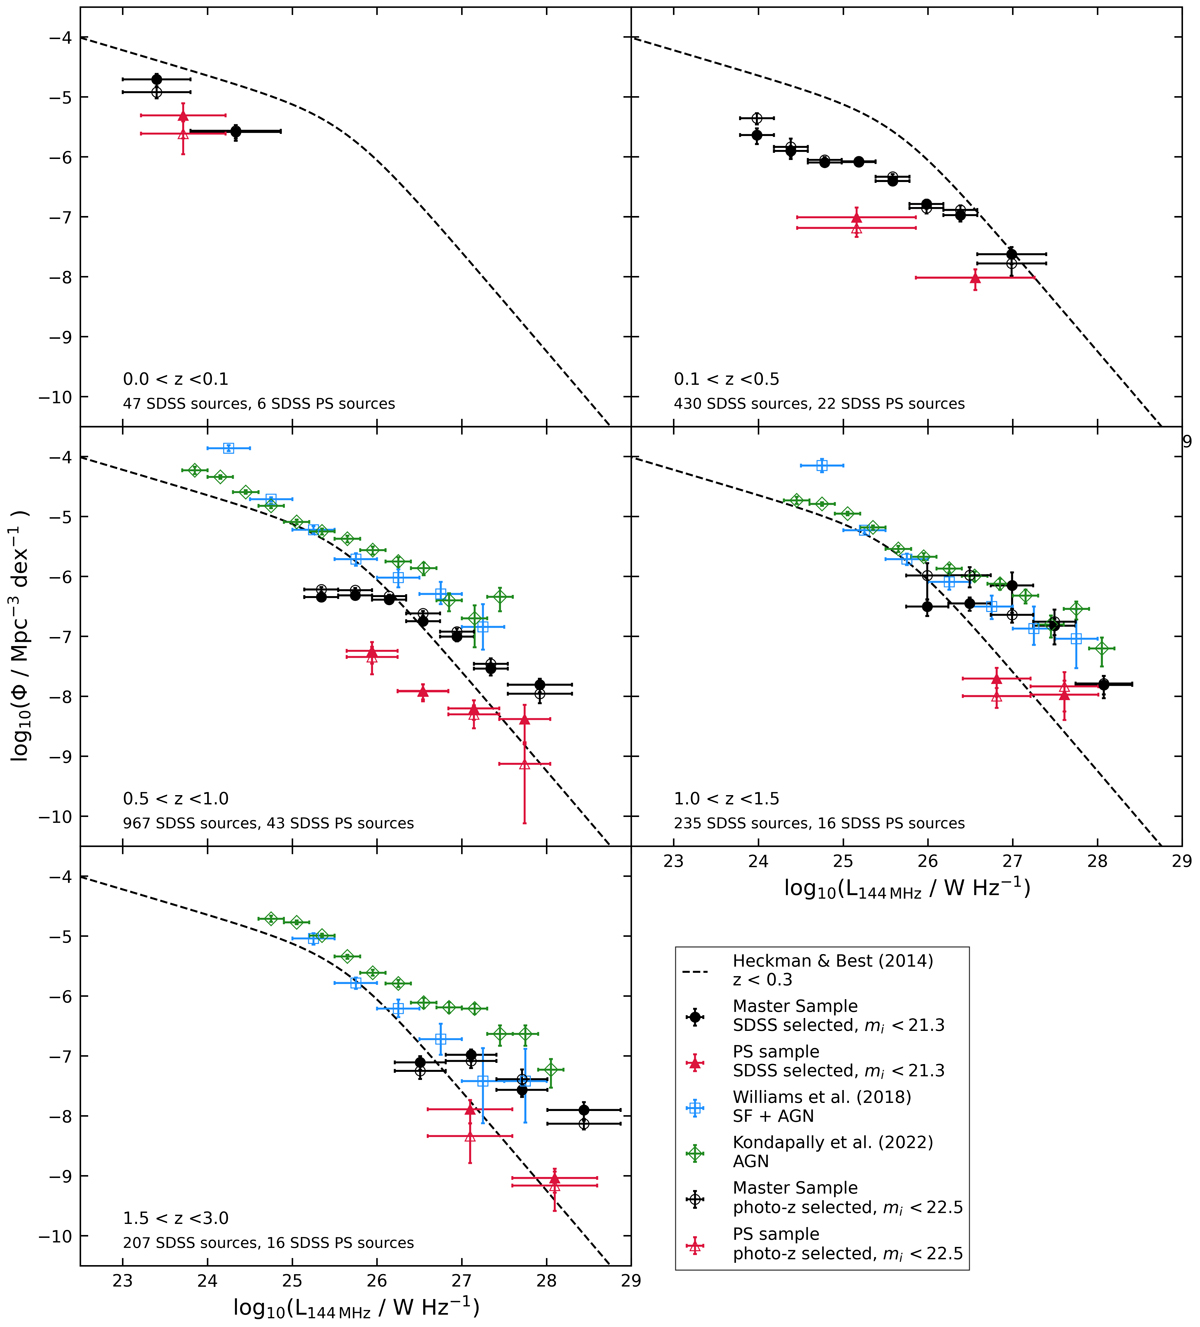
Fig. 11.
Download original image
144 MHz luminosity function, Φ, for the Master sample (black circles) and PS sample (red squares) at different redshifts. The filled symbols show the SDSS selected sample, and the open symbols show the photo-z selected sample. The number of sources in the Master sample and PS sample for each redshift range are shown at the bottom left of their respective plots. The grey curve corresponds to the double power-law model for the AGN local (z ≃ 0.1) luminosity function at 1.4 GHz parametrised by Heckman & Best (2014), converted to 144 MHz using a spectral index −0.7. The 150 MHz luminosity functions for the SF+AGN sample presented by Williams et al. (2018), and the AGN sample presented by Kondapally et al. (2022) are shown as blue squares and green diamonds, respectively. For the z > 1 bins, both the PS and Master sample luminosity functions are not representative of a complete sample due to their optical incompleteness. However, since the optical incompleteness is identical between the PS and Master samples, the offset is a true reflection of evolution between the samples.
Current usage metrics show cumulative count of Article Views (full-text article views including HTML views, PDF and ePub downloads, according to the available data) and Abstracts Views on Vision4Press platform.
Data correspond to usage on the plateform after 2015. The current usage metrics is available 48-96 hours after online publication and is updated daily on week days.
Initial download of the metrics may take a while.