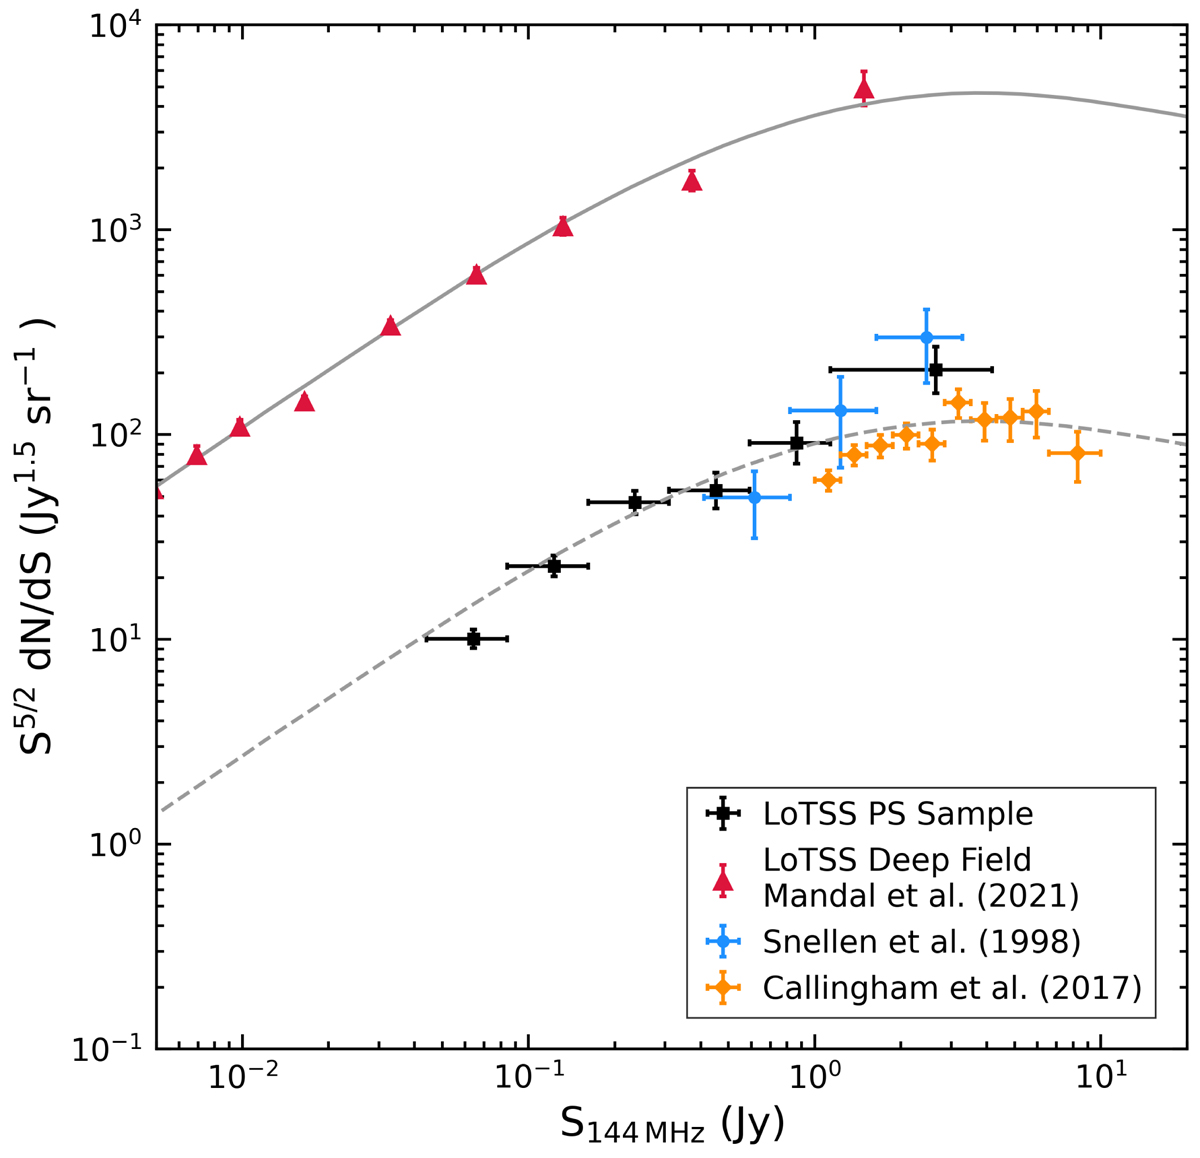
Fig. 10.
Download original image
Euclidean normalised differential source counts for different samples of PS sources. The black squares show our sample of PS sources. The blue circles show the Snellen et al. (1998) PS sample converted to 144 MHz. The orange diamonds show the Callingham et al. (2017) PS sample. For reference, the source counts for the LoTSS Deep Field derived by Mandal et al. (2021) are plotted as red triangles. The solid grey line shows the model for 150 MHz AGN source counts proposed by Massardi et al. (2010). The dashed grey line shows the Massardi et al. (2010) model scaled down by a factor of 40, which is consistent with the PS source data.
Current usage metrics show cumulative count of Article Views (full-text article views including HTML views, PDF and ePub downloads, according to the available data) and Abstracts Views on Vision4Press platform.
Data correspond to usage on the plateform after 2015. The current usage metrics is available 48-96 hours after online publication and is updated daily on week days.
Initial download of the metrics may take a while.