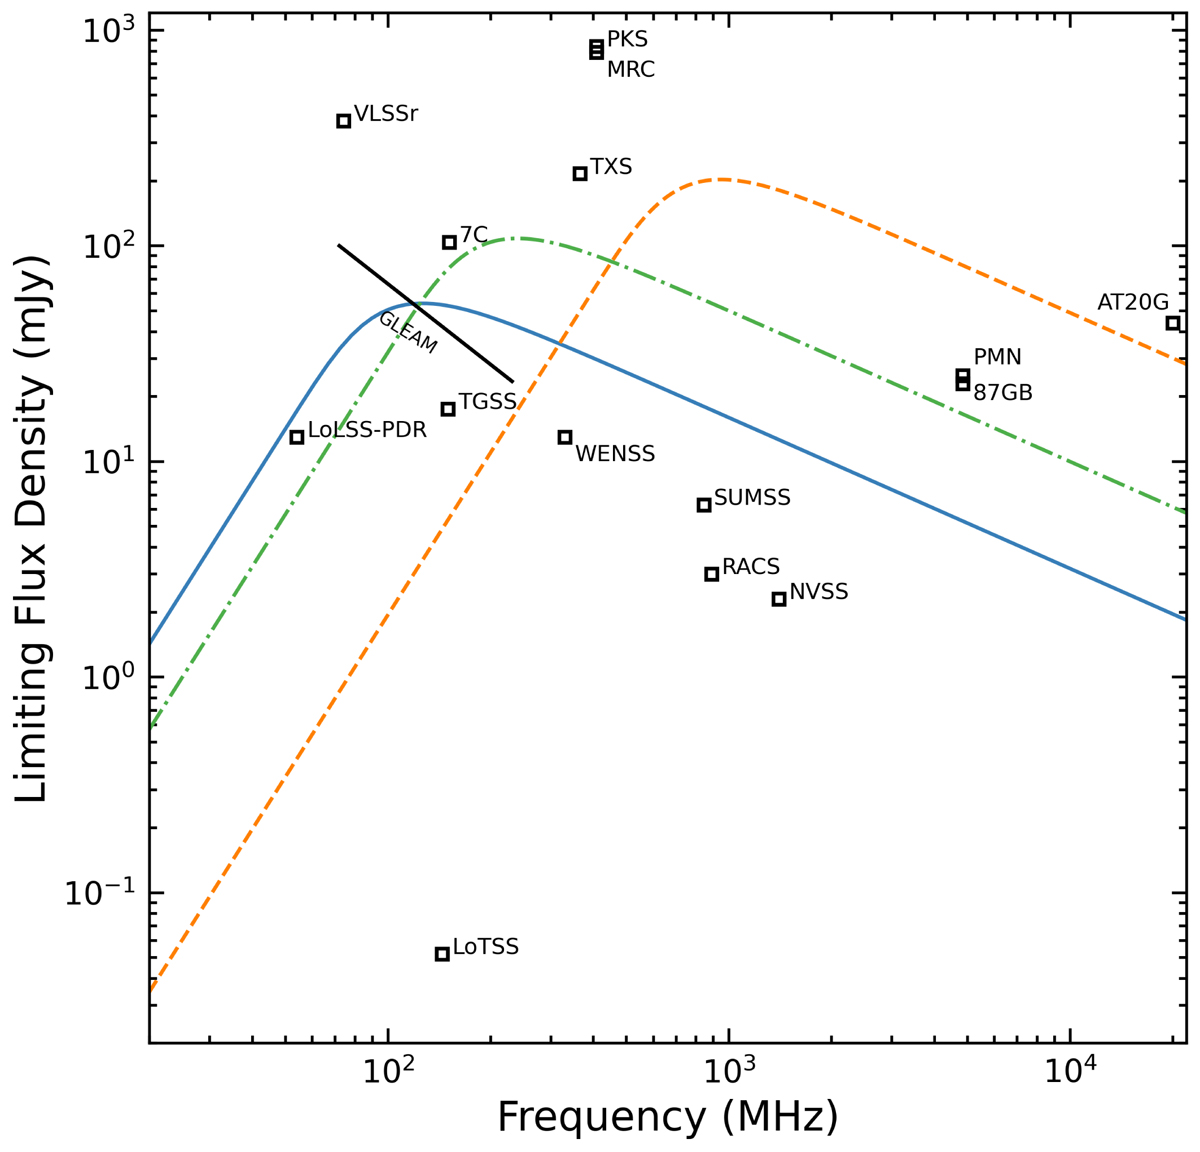
Fig. 1.
Download original image
Limiting flux densities and frequencies for major radio surveys. The limiting flux density for a survey is given by the faintest catalogued source flux density. The GLEAM survey is represented as a black line since it has variable limiting flux densities over its range of observing frequencies. The orange dashed curve represents the observational limit for the sample presented by O’Dea (1998). This is given by an SSA spectrum of a PS source with a peak at 750 MHz and an observed peak flux density of 300 mJy. The green dash-dotted curve represents the observational limit for the sample presented by Callingham et al. (2017). This is given by an SSA spectrum of a PS source with a peak at 190 MHz, with a faintest observed peak flux density of 160 mJy. The blue curve represents the theoretical observational limit of PS sources in this study. This is given by an SSA spectrum of a PS source with a peak at 100 MHz, with a faintest peak flux density of 80 mJy, based on the limiting flux densities of LoLSS-PDR, LoTSS, and NVSS. This figure also illustrates that in this study LoLSS is the survey that dictates the limiting flux density for identifying PS sources. The following plotted surveys were not previously mentioned: Cambridge 7C (Hales et al. 2007) survey, Westerbork Northern Sky Survey (WENSS; Rengelink et al. 1997), Texas Survey (TXS; Douglas et al. 1996), Molonglo Reference Catalogue (MRC; Large et al. 1991), Parkes (PKS; Wright & Otrupcek 1990) survey, Sydney University Molonglo Sky Survey (SUMSS; Mauch et al. 2003), MIT-Green Bank 5 GHz (87GB; Gregory & Condon 1991) survey, Parkes-MIT-NRAO (PMN; Wright et al. 1994) survey, Australia Telescope 20 GHz (AT20G; Murphy et al. 2010) survey, and the Rapid ASKAP Continuum Survey (RACS; Hale et al. 2021).
Current usage metrics show cumulative count of Article Views (full-text article views including HTML views, PDF and ePub downloads, according to the available data) and Abstracts Views on Vision4Press platform.
Data correspond to usage on the plateform after 2015. The current usage metrics is available 48-96 hours after online publication and is updated daily on week days.
Initial download of the metrics may take a while.