Fig. 12.
Download original image
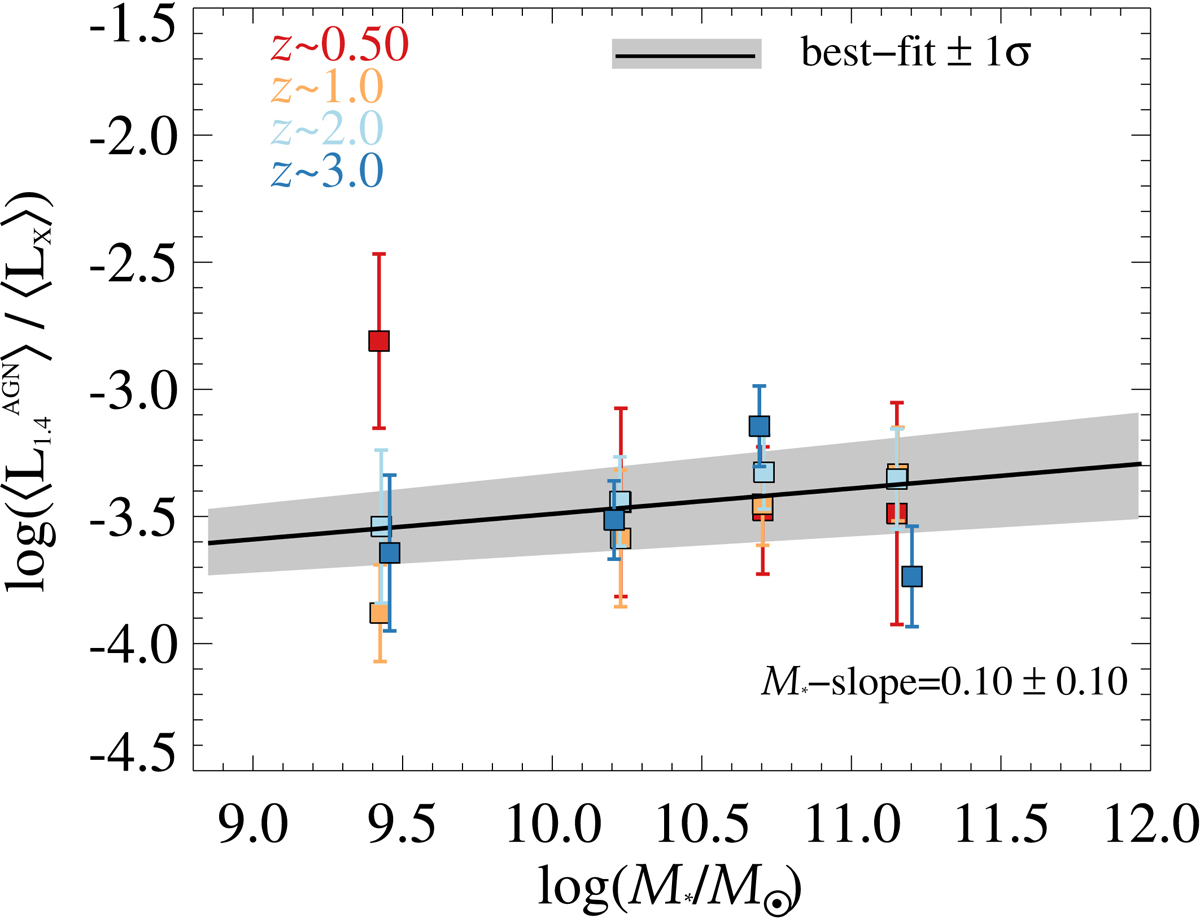
Logarithmic ratio between our ![]() measurements and the ⟨LX⟩ obtained from X-ray stacking (Carraro et al. 2020), as a function of ℳ*, coloured by redshift. The black line indicates the best-fit ratio with ℳ*, by imposing a z-invariant trend, which returns a ℳ*-slope of 0.10 ± 0.10. The grey shaded area marks the ±1σ confidence interval after propagating the parameter uncertainties. See Sect. 6.4.2 for details.
measurements and the ⟨LX⟩ obtained from X-ray stacking (Carraro et al. 2020), as a function of ℳ*, coloured by redshift. The black line indicates the best-fit ratio with ℳ*, by imposing a z-invariant trend, which returns a ℳ*-slope of 0.10 ± 0.10. The grey shaded area marks the ±1σ confidence interval after propagating the parameter uncertainties. See Sect. 6.4.2 for details.
Current usage metrics show cumulative count of Article Views (full-text article views including HTML views, PDF and ePub downloads, according to the available data) and Abstracts Views on Vision4Press platform.
Data correspond to usage on the plateform after 2015. The current usage metrics is available 48-96 hours after online publication and is updated daily on week days.
Initial download of the metrics may take a while.