Open Access
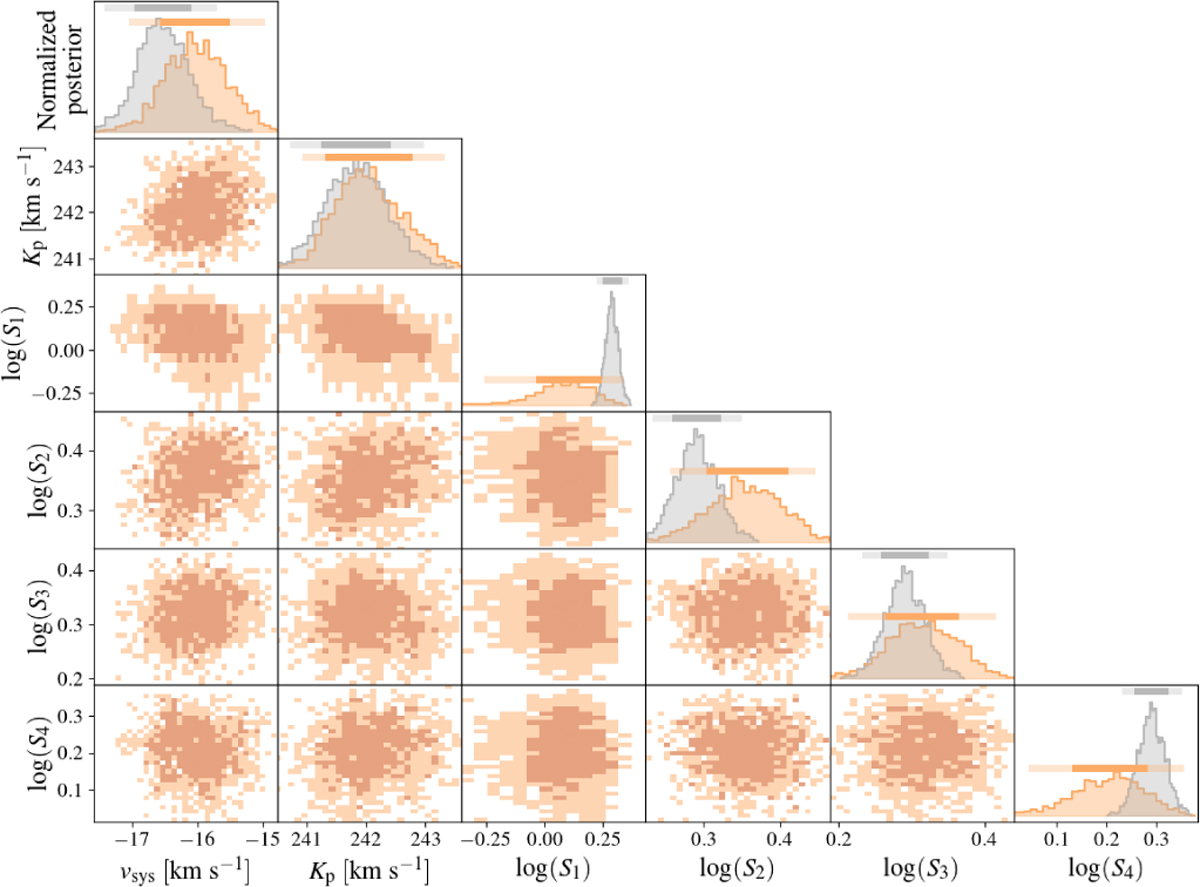
Fig. E.1
Download original image
Corner plot showing posteriors for model 4C (orange). We overlay 1D posteriors for model 1C in grey. The posteriors for log S1 … log S4 are all compared to the posterior for the individual scaling factor log S of model 1C. We zoom into the 1σ and 2σ confidence interval regions for each parameter.
Current usage metrics show cumulative count of Article Views (full-text article views including HTML views, PDF and ePub downloads, according to the available data) and Abstracts Views on Vision4Press platform.
Data correspond to usage on the plateform after 2015. The current usage metrics is available 48-96 hours after online publication and is updated daily on week days.
Initial download of the metrics may take a while.