Fig. 8
Download original image
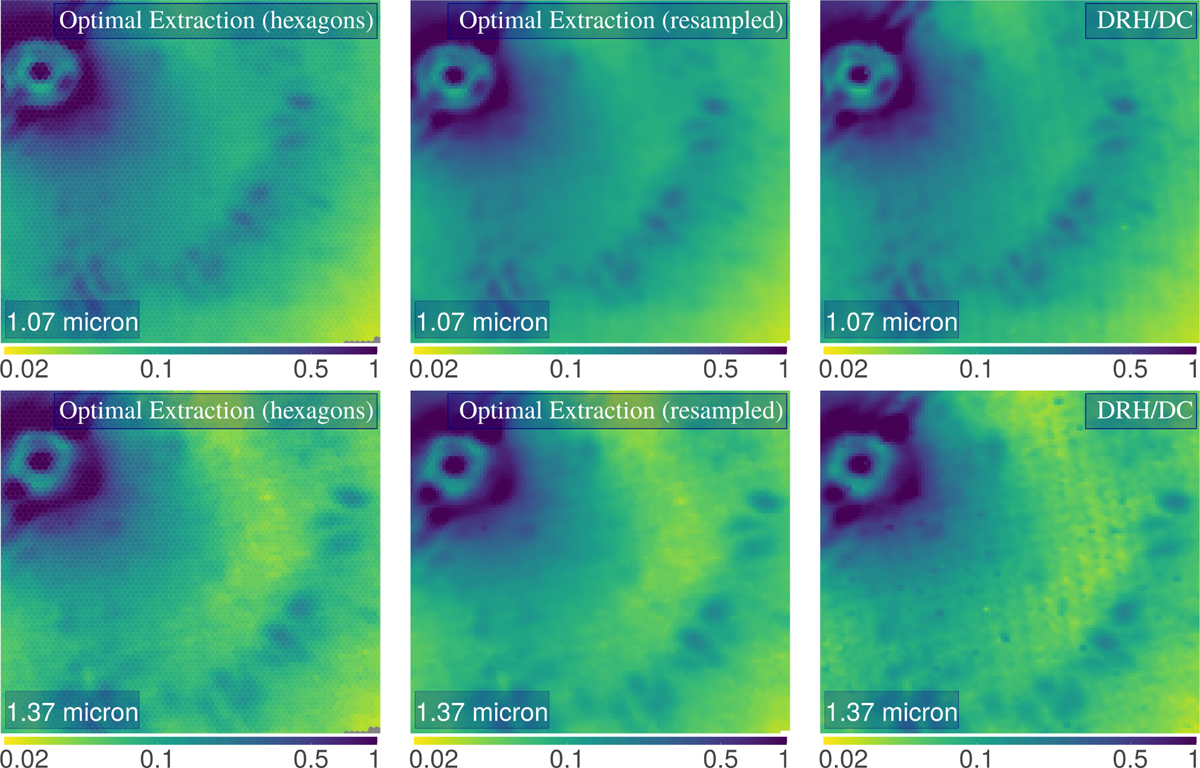
Comparison of normalized image slices extracted from the 2015 51 Eri data set with our pipeline and the DRH/DC for two wavelengths: one at high S/N (top row) and one at low S/N (bottom row). Top row: at the peak of emission at around 1065 nm, shown in logarithmic scale. Bottom row: same for the channel with the lowest S/N, at around 1370 nm. From left to right: optimal extraction frame (YH-mode) in hexagonal geometry; the same frame resampled to rectilinear grid; DRH pipeline reduction with additional routines for crosstalk correction and wavelength correction from the SPHERE DC.
Current usage metrics show cumulative count of Article Views (full-text article views including HTML views, PDF and ePub downloads, according to the available data) and Abstracts Views on Vision4Press platform.
Data correspond to usage on the plateform after 2015. The current usage metrics is available 48-96 hours after online publication and is updated daily on week days.
Initial download of the metrics may take a while.