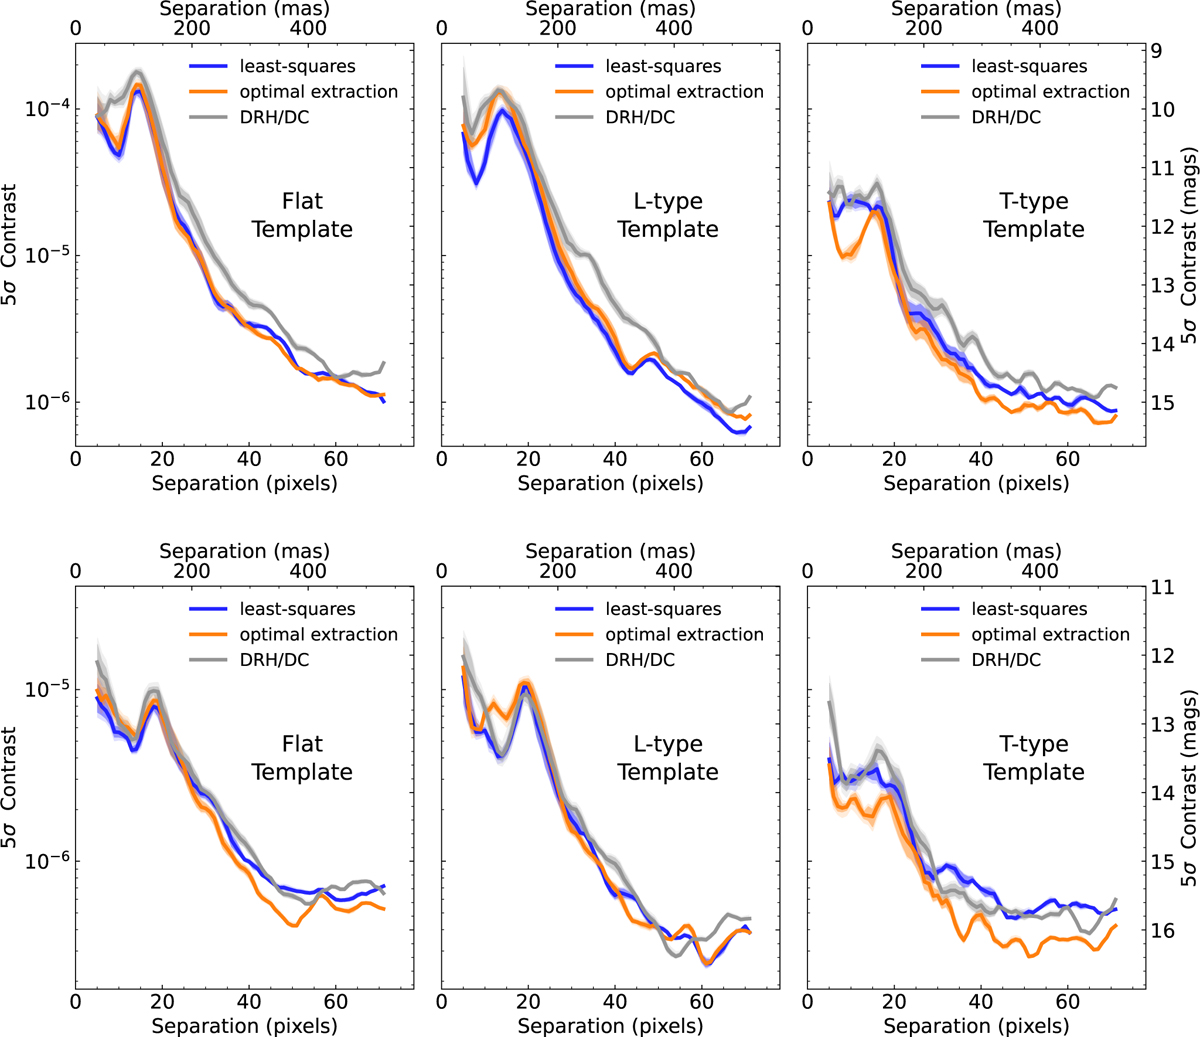
Fig. 11
Download original image
Contrast curves for 51 Eri obtained from using TRAP on image cubes extracted using our pipeline and the DRH/DC pipeline. Upper row: results for the 2015 data, and the lower row shows the results for the better 2017 data. The individual panels show different spectral templates of planetary companions that were used to combined the contrast curves over the IFS wavelength channels: flat contrast, which corresponds to a mean contrast over all channels, and L-type and T-type spectral contrast templates.
Current usage metrics show cumulative count of Article Views (full-text article views including HTML views, PDF and ePub downloads, according to the available data) and Abstracts Views on Vision4Press platform.
Data correspond to usage on the plateform after 2015. The current usage metrics is available 48-96 hours after online publication and is updated daily on week days.
Initial download of the metrics may take a while.