Open Access
Fig. 7
Download original image
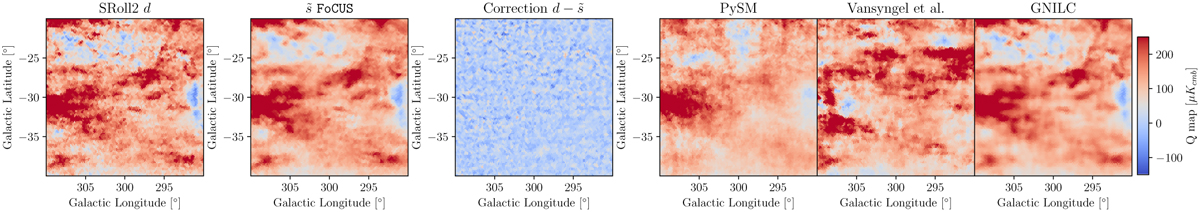
Zoom on a sky region of the Q map. From left to right panels: SRoll 2.0 data, the FoCUS map, the correction computed by FoCUS to be applied to the SRoll2.0 map, the PySM dl model, the Vansyngel et al. (2017) map, and the GNILC map.
Current usage metrics show cumulative count of Article Views (full-text article views including HTML views, PDF and ePub downloads, according to the available data) and Abstracts Views on Vision4Press platform.
Data correspond to usage on the plateform after 2015. The current usage metrics is available 48-96 hours after online publication and is updated daily on week days.
Initial download of the metrics may take a while.