Fig. 2
Download original image
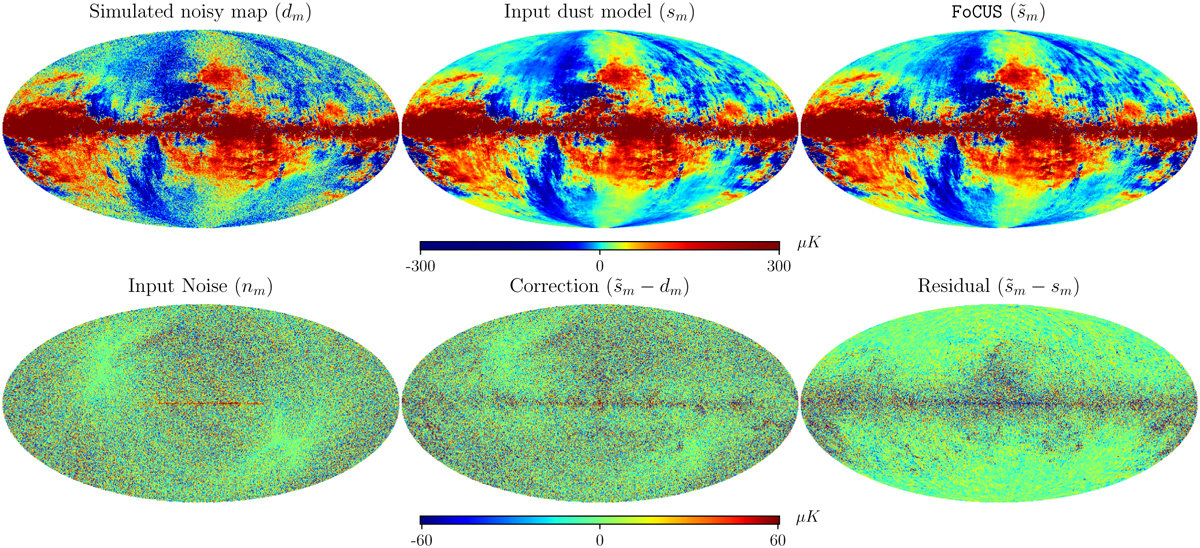
Stokes Q maps illustrating the validation on mock data. Top row, left to right: one realisation of the noisy mock data, the noise-free Vansyngel model, and the result of the FoCUS algorithm. Bottom row, left to right: noise map used in the data simulation, the correction found by the FoCUS method, and the residual map, i.e. the difference between the Vansyngel model and the FoCUS map.
Current usage metrics show cumulative count of Article Views (full-text article views including HTML views, PDF and ePub downloads, according to the available data) and Abstracts Views on Vision4Press platform.
Data correspond to usage on the plateform after 2015. The current usage metrics is available 48-96 hours after online publication and is updated daily on week days.
Initial download of the metrics may take a while.