Fig. 10
Download original image
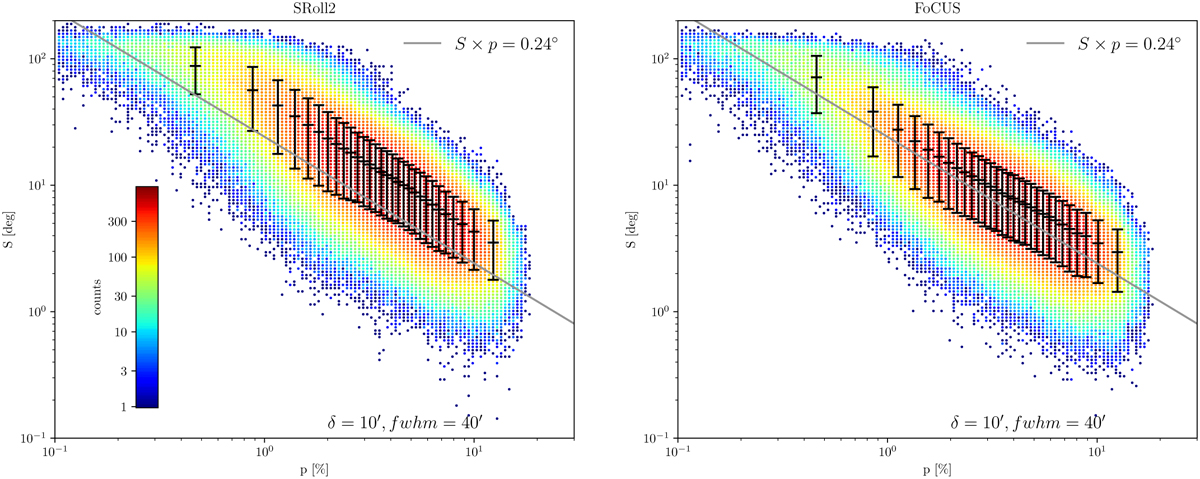
Distribution of the polarisation angle dispersion S and the polarisation fraction p values for the SRoll2 (left panel) and FoCUS (right panel) maps. The data points with error bars represent the mean value and 1 σ dispersion of S within bins of p. The data binning and representation follows that of Fig. 10 of Planck Collaboration XII (2020). The grey line shows the relation S×p = 0.24°, which is expected based on the analytical model of Planck Collaboration XII (2020) for the resolution FWHM = 40′ we used.
Current usage metrics show cumulative count of Article Views (full-text article views including HTML views, PDF and ePub downloads, according to the available data) and Abstracts Views on Vision4Press platform.
Data correspond to usage on the plateform after 2015. The current usage metrics is available 48-96 hours after online publication and is updated daily on week days.
Initial download of the metrics may take a while.