Fig. 6
Download original image
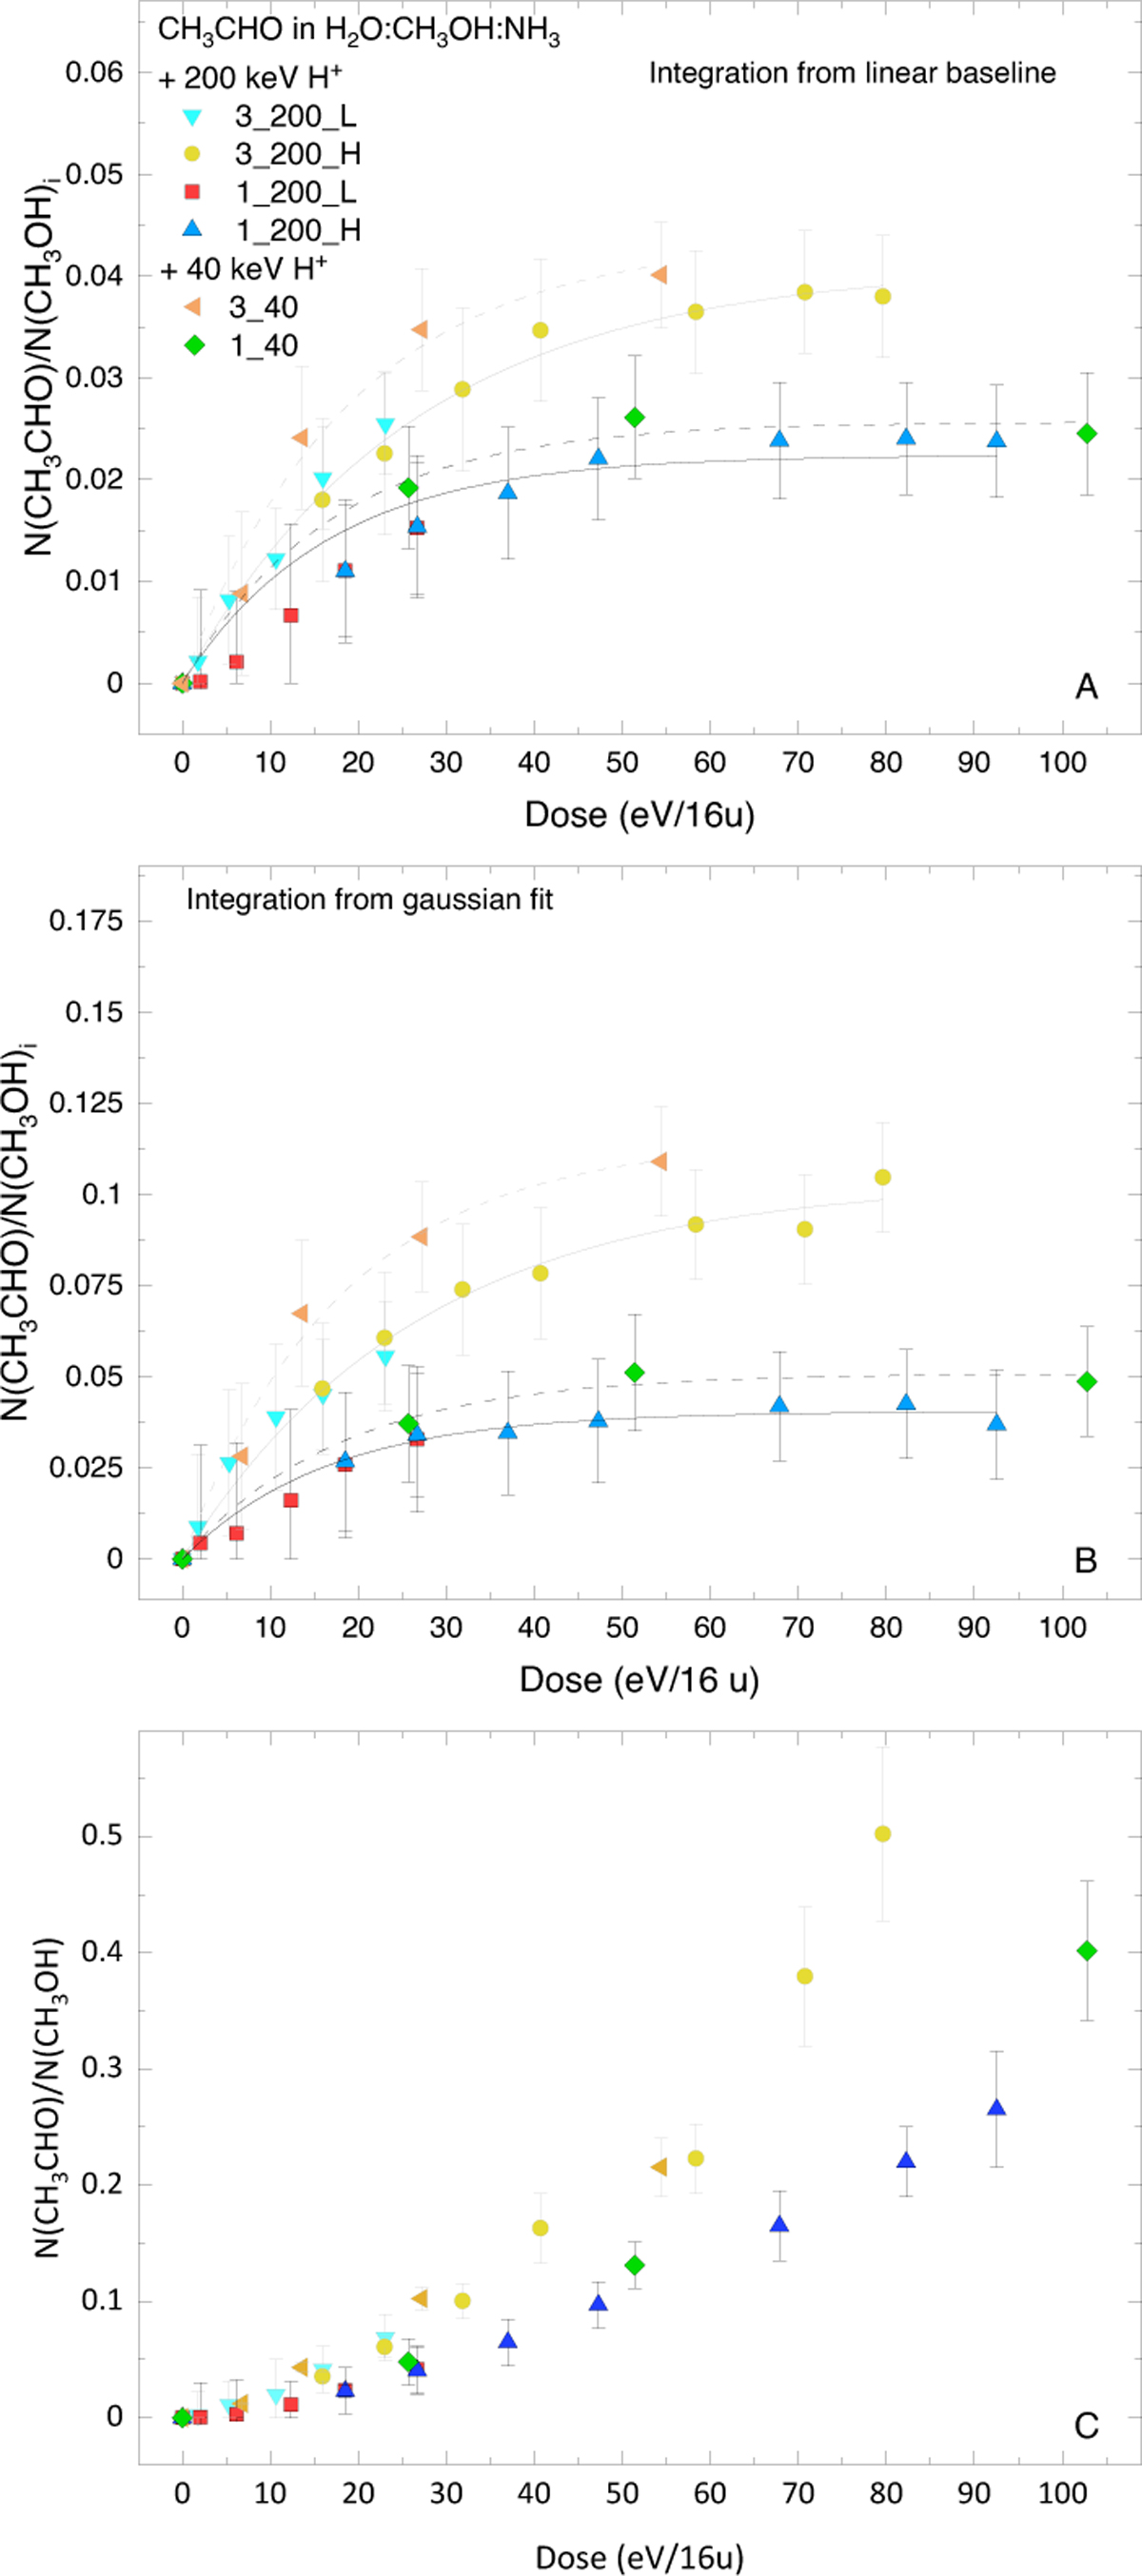
CH3CHO column density with respect to the initial methanol abundance ((CH3OH)i, panels A and B) or during irradiation (CH3OH, panel C). Estimates are based on the analysis of the 1350 cm−1 band for CH3CHO and on the 1025 cm−1 band for CH3OH. Panel A: estimates obtained after the subtraction of a linear baseline between 1360 and 1330 cm−1 and integration of the 1350 cm−1 band intensity. Panel B: estimates obtained from the integration of Gaussian curves centred at about 1350 cm−1 obtained after a multi-Gaussian fit performed in the range 1500–1300 cm−1. Panel C: CH3CHO with respect to the amount of CH3OH during irradiation. The ratio is calculated using the abundances of CH3CHO obtained with the method of the integration from linear baseline.
Current usage metrics show cumulative count of Article Views (full-text article views including HTML views, PDF and ePub downloads, according to the available data) and Abstracts Views on Vision4Press platform.
Data correspond to usage on the plateform after 2015. The current usage metrics is available 48-96 hours after online publication and is updated daily on week days.
Initial download of the metrics may take a while.