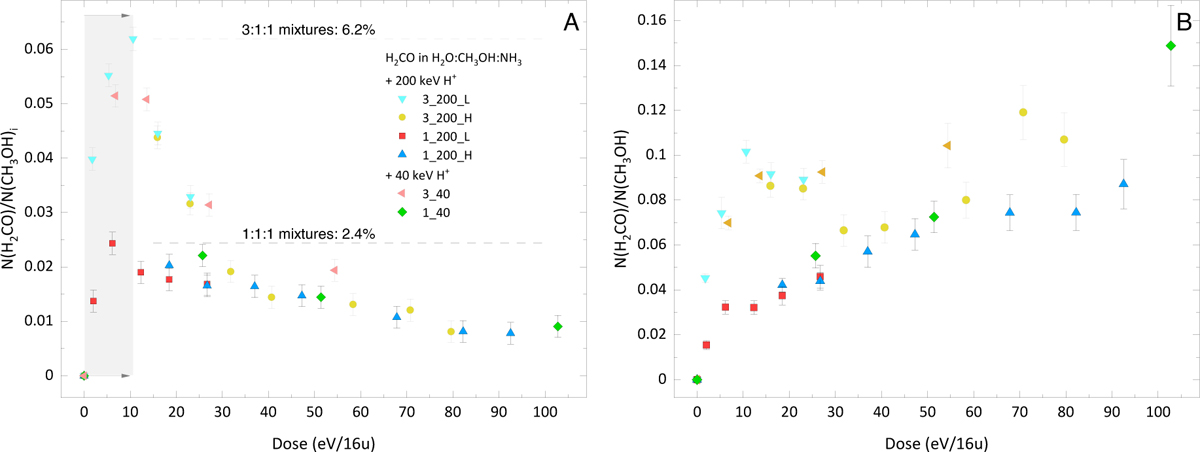
Fig. 5
Download original image
H2CO in H2O:CH3OH:NH3 mixtures exposed to ion bombardment. Estimates are based on the analysis of the 1250 cm−1 band for H2CO and 1025 cm−1 for CH3OH and are normalized to the initial methanol abundance, (CH3OH)i. Panel A: H2CO as a function of dose, with respect to the amount of deposited CH3OH. The grey area shows the range in which the H2CO abundance was found to increase with increasing the dose. The horizontal dashed line indicates the maximum amount of H2CO found in 1:1:1 mixtures (dashed black line) and 3:1:1 mixtures (dashed grey line). Panel B: H2CO with respect to the CH3OH at the same irradiation dose.
Current usage metrics show cumulative count of Article Views (full-text article views including HTML views, PDF and ePub downloads, according to the available data) and Abstracts Views on Vision4Press platform.
Data correspond to usage on the plateform after 2015. The current usage metrics is available 48-96 hours after online publication and is updated daily on week days.
Initial download of the metrics may take a while.