Fig. 3
Download original image
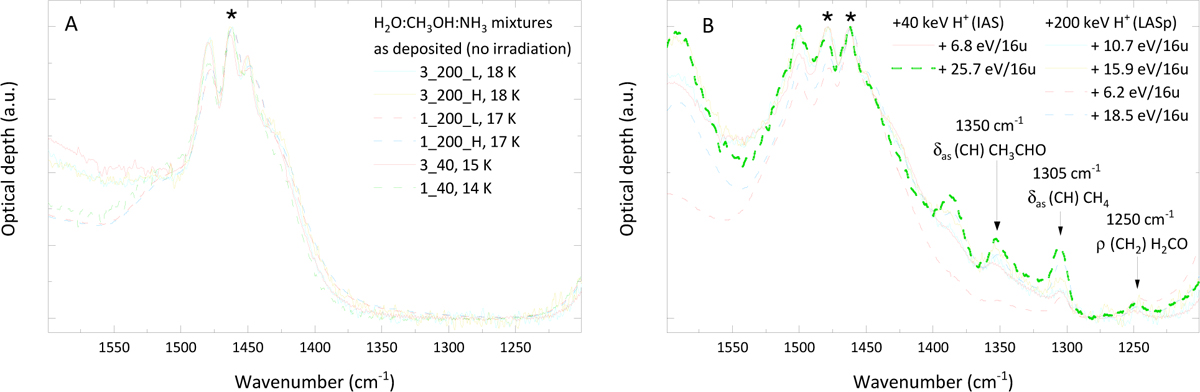
1600-1200 cm−1 spectra of H2O:CH3OH:NH3 mixtures as deposited (panel A) and after irradiation with 40 or 200 keV H+. For a better comparison, spectra were normalized to the most intense peak (marked with an asterisk) between 1478 and 1462 cm−1. In the spectra in panel A the spectral continuum at about 1550 cm−1 is affected by the amount of water in the mixture. The continuum is higher in 3:1:1 mixtures because of the higher amount of water with respect to 1:1:1 mixtures.
Current usage metrics show cumulative count of Article Views (full-text article views including HTML views, PDF and ePub downloads, according to the available data) and Abstracts Views on Vision4Press platform.
Data correspond to usage on the plateform after 2015. The current usage metrics is available 48-96 hours after online publication and is updated daily on week days.
Initial download of the metrics may take a while.