Fig. 5
Download original image
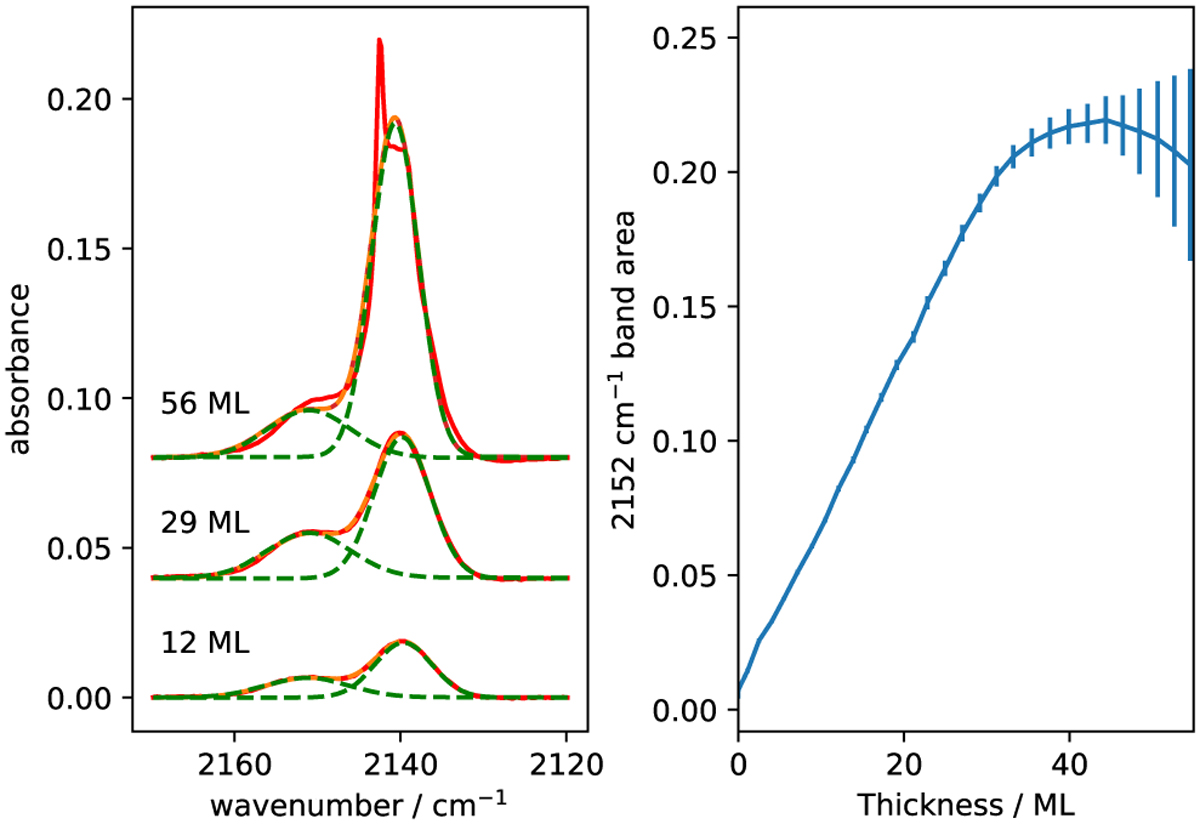
Illustration of the method for determination of 2152 cm−1 band area. Left panel: examples of the fitting of the CO absorption profile using the sum of two Gaussian functions. The red lines are the measured spectra, the dashed green lines are the two Gaussian components, and the orange lines are the total fitting. Spectra are offset for clarity. Right panel: band area of the 2152 cm−1 component during CO deposition; the error bar of the fitting is also shown. The large error bar at larger thickness is due to the emergence of the LO peak at 2143 cm−1.
Current usage metrics show cumulative count of Article Views (full-text article views including HTML views, PDF and ePub downloads, according to the available data) and Abstracts Views on Vision4Press platform.
Data correspond to usage on the plateform after 2015. The current usage metrics is available 48-96 hours after online publication and is updated daily on week days.
Initial download of the metrics may take a while.