Open Access
Fig. 3
Download original image
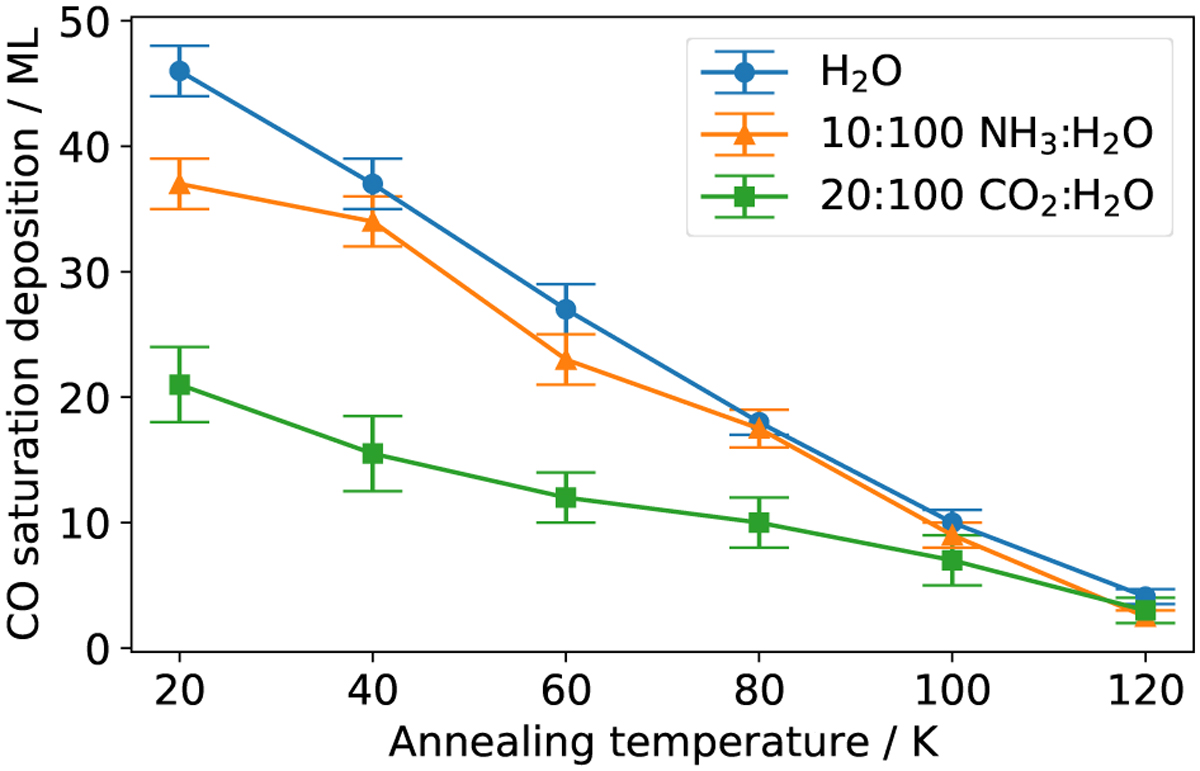
Pore surface area of water-dominated ice (mixture) that is annealed to different temperatures, as determined from Fig. 2. The surface area is the CO deposition dose at which the 2143 cm−1 peak emerges.
Current usage metrics show cumulative count of Article Views (full-text article views including HTML views, PDF and ePub downloads, according to the available data) and Abstracts Views on Vision4Press platform.
Data correspond to usage on the plateform after 2015. The current usage metrics is available 48-96 hours after online publication and is updated daily on week days.
Initial download of the metrics may take a while.