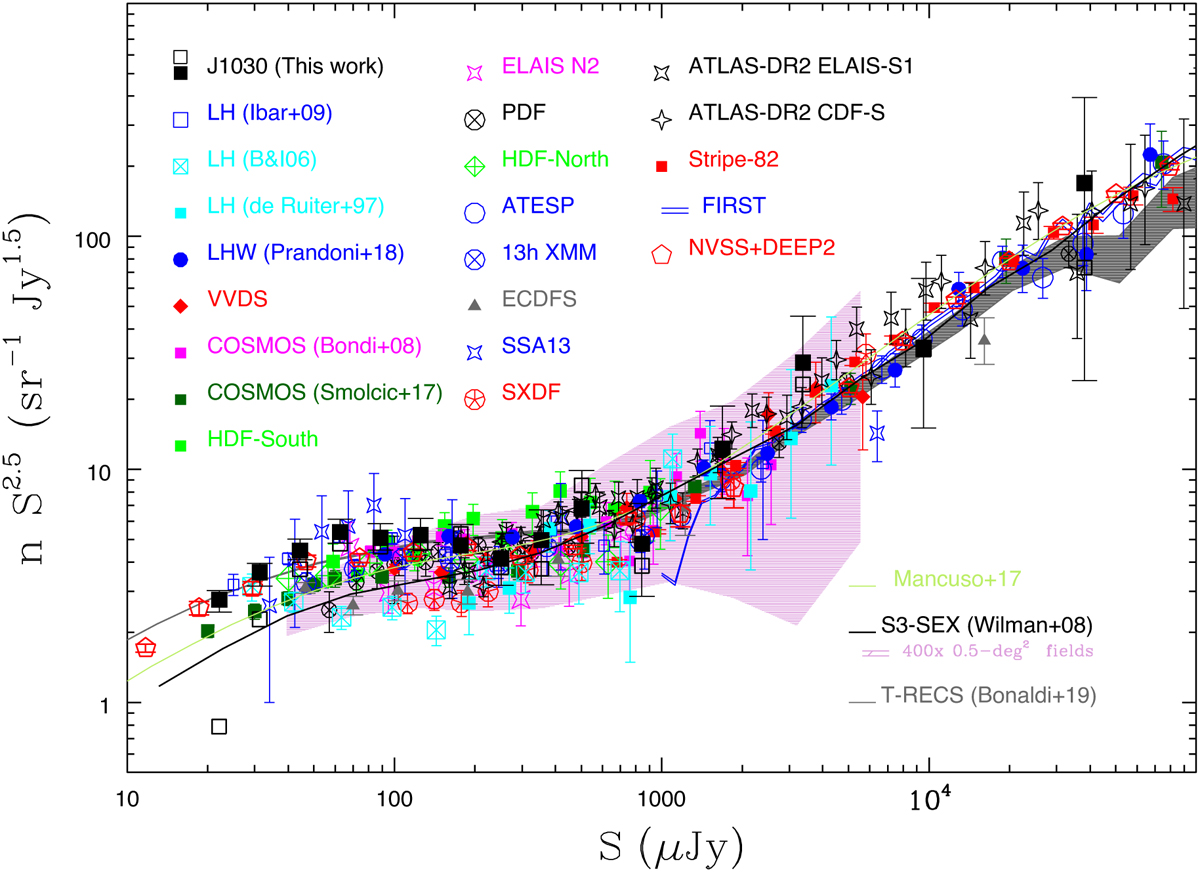
Fig. 9
Download original image
Normalized 1.4 GHz differential source counts for different samples (as indicated in the figure and in the text). The counts derived from the catalog discussed in this work are represented as filled black squares, and have been rescaled from 1.34 GHz to 1.4 GHz by assuming a spectral slope α = −0.7. Vertical bars represent the squared sum of Poissonian and systematic errors on the normalized counts (see text for more details). The empty black squares show the same counts, before applying the corrections for the visibility function and for the systematic effects discussed in Sect. 3. We also show the source counts derived from the Wilman et al. (2008, S3-SEX), Bonaldi et al. (2019, T-RECS) and Mancuso et al. (2017) 1.4 GHz simulations, which represent the summed contribution of the modeling of various source populations (RL and RQ AGN; SFGs). The predicted spread due to cosmic variance for 0.5 deg2 fields is represented by the pink shaded area. It has been obtained by splitting the S3-SEX simulation in 400 0.5-deg2 fields.
Current usage metrics show cumulative count of Article Views (full-text article views including HTML views, PDF and ePub downloads, according to the available data) and Abstracts Views on Vision4Press platform.
Data correspond to usage on the plateform after 2015. The current usage metrics is available 48-96 hours after online publication and is updated daily on week days.
Initial download of the metrics may take a while.