Fig. 8
Download original image
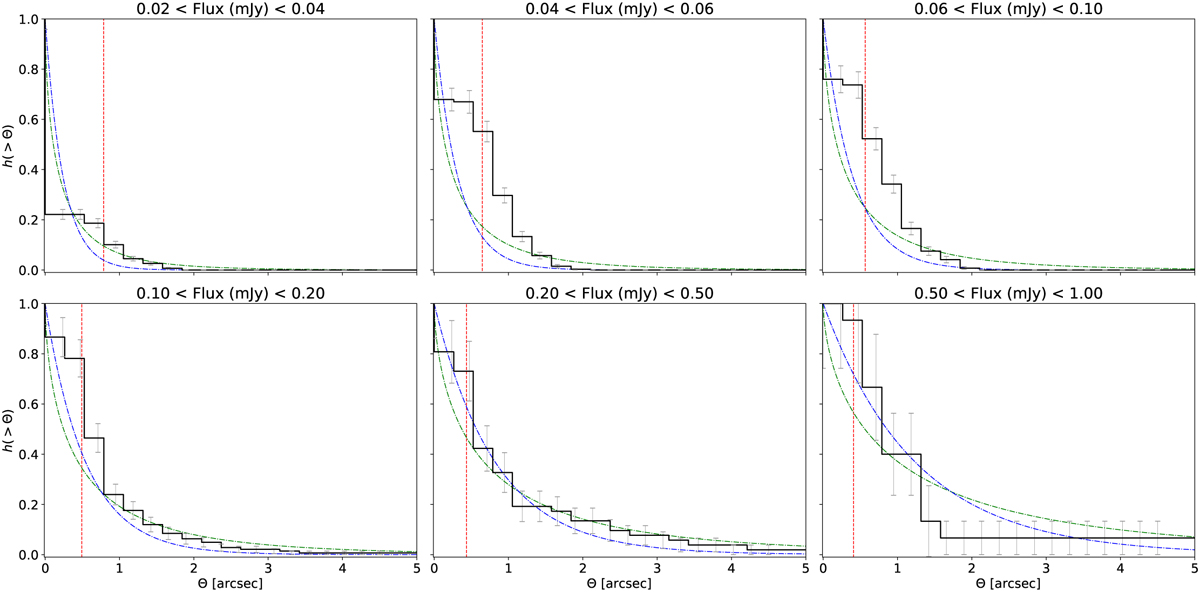
Cumulative size distribution of our sources (black solid line) in six flux density bins, with 1σ error indicated by the gray bars. The red dashed line is the minimum deconvolved size (Eq. (9)), while the green and blue dash-dotted lines are the cumulative distribution functions described by Eq. (10), obtained by assuming q = 0.62 and q = 1 respectively. All lines are calculated at the geometric mean of each flux bin.
Current usage metrics show cumulative count of Article Views (full-text article views including HTML views, PDF and ePub downloads, according to the available data) and Abstracts Views on Vision4Press platform.
Data correspond to usage on the plateform after 2015. The current usage metrics is available 48-96 hours after online publication and is updated daily on week days.
Initial download of the metrics may take a while.