Fig. 6
Download original image
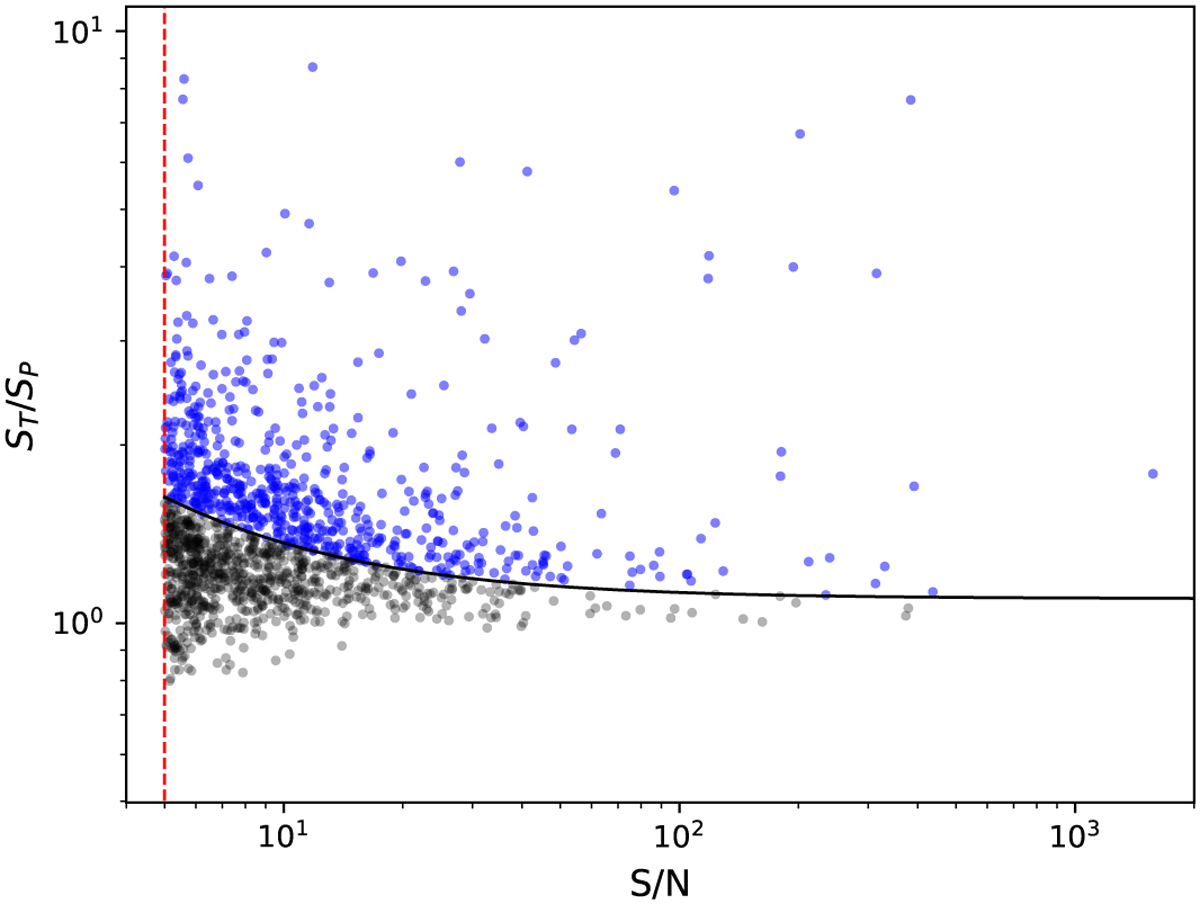
Ratio between the total flux (ST) and peak flux (SP) for the sources of our catalog, as a function of S/N. The red vertical dashed line marks the detection threshold (S/N = 5). The black solid line (see Eq. (7)) divides the resolved sources (above the line, blue points) from the unresolved sources (below the line, black points).
Current usage metrics show cumulative count of Article Views (full-text article views including HTML views, PDF and ePub downloads, according to the available data) and Abstracts Views on Vision4Press platform.
Data correspond to usage on the plateform after 2015. The current usage metrics is available 48-96 hours after online publication and is updated daily on week days.
Initial download of the metrics may take a while.