Fig. 3
Download original image
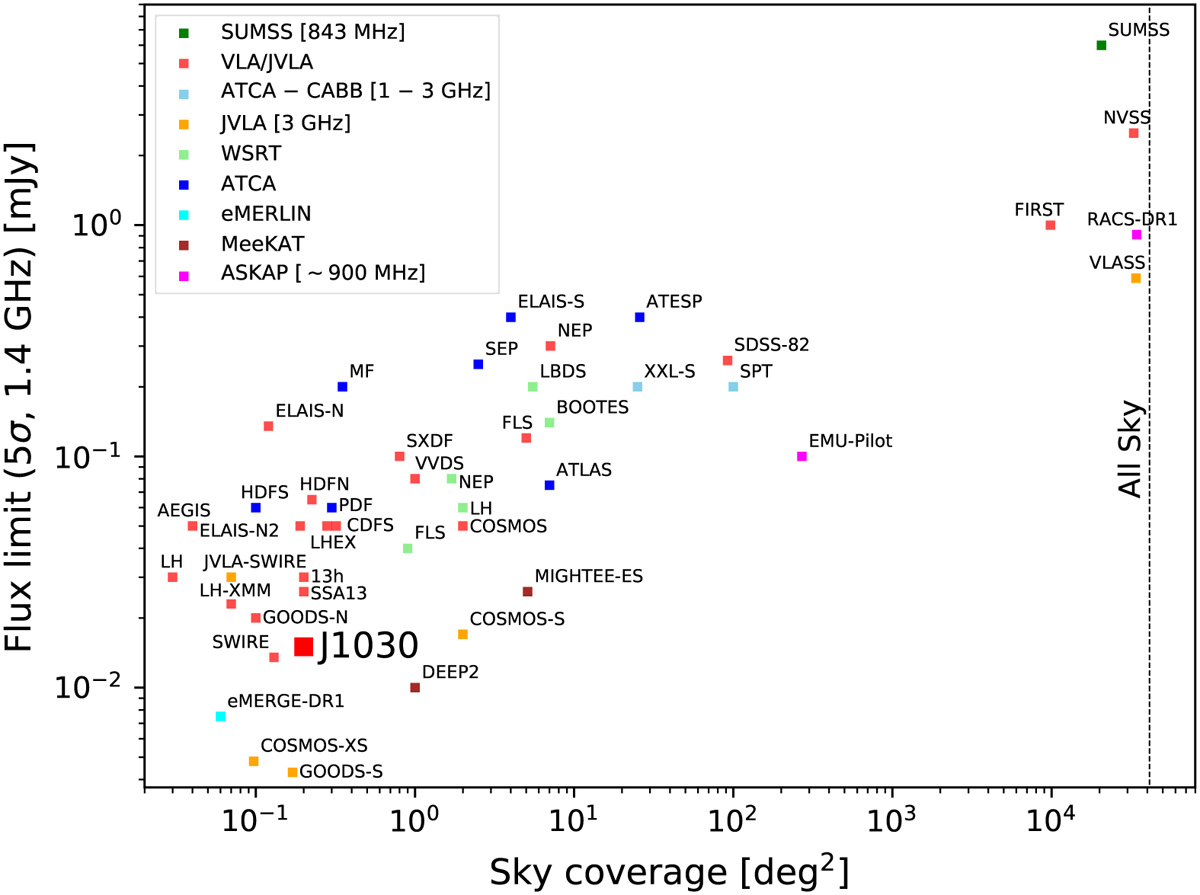
Sky coverage versus 5σ sensitivity for a collection of available ~GHz radio surveys to date, color-coded by the instrument as in the legend. The sensitivities refer to 1.4GHz; the surveys at other frequencies have been rescaled to 1.4GHz assuming a radio spectral index of ~0.7. The large red square indicates the J1030 field presented in this work. The reported surveys are as follows: LBDS (Windhorst et al. 1984), NEP (VLA, Kollgaard et al. 1994), FIRST (White et al. 1997), MF (Gruppioni et al. 1997), NVSS (Condon et al. 1998), PDF (Hopkins et al. 1998), ELAIS-S (Gruppioni et al. 1999), ELAIS-N (Ciliegi et al. 1999), SUMSS (Bock et al. 1999), ATESP (Prandoni et al. 2000), BOOTES (de Vries et al. 2002), VVDS (Bondi et al. 2003), FLS (VLA, Condon et al. 2003), FLS (WSRT, Morganti et al. 2004), 13 h (Seymour et al. 2004), HDFN (Huynh et al. 2005), LHEX (Oyabu et al. 2005), SXDF (Simpson et al. 2006), ELAIS-N2, LH-XMM and HDFN (Biggs & Ivison 2006), SSA13 (Fomalont et al. 2006), ATLAS (Norris et al. 2006), COSMOS (Schinnerer et al. 2007), AEGIS (Ivison et al. 2007), SWIRE (Owen & Morrison 2008), LH (VLA, Ibar et al. 2009), NEP (WSRT, White et al. 2010), GOODS–N (Morrison et al. 2010), SDSS–82 (Hodge et al. 2011), JVLA–SWIRE (Condon et al. 2012), SEP (White et al. 2012), CDFS (Miller et al. 2013), COSMOS–S (Smolćić et al. 2017a), LH (WSRT, Prandoni et al. 2018), RACS–DR1 (McConnell et al. 2020), MIGHTEE–ES (Heywood et al. 2021), DEEP2 (Matthews et al. 2021), EMU-Pilot (Norris et al. 2021), COSMOS-XS (van der Vlugt et al. 2021), GOODS-S (Lyu et al. 2022), VLASS (ongoing, Lacy et al. 2016), eMERGE-DR1 (ongoing, Muxlow et al. 2020), SPT (ongoing, PI: N. Tothill), XXL-S (ongoing as part of SPT, PI: V. Smolćić).
Current usage metrics show cumulative count of Article Views (full-text article views including HTML views, PDF and ePub downloads, according to the available data) and Abstracts Views on Vision4Press platform.
Data correspond to usage on the plateform after 2015. The current usage metrics is available 48-96 hours after online publication and is updated daily on week days.
Initial download of the metrics may take a while.