Fig. 13
Download original image
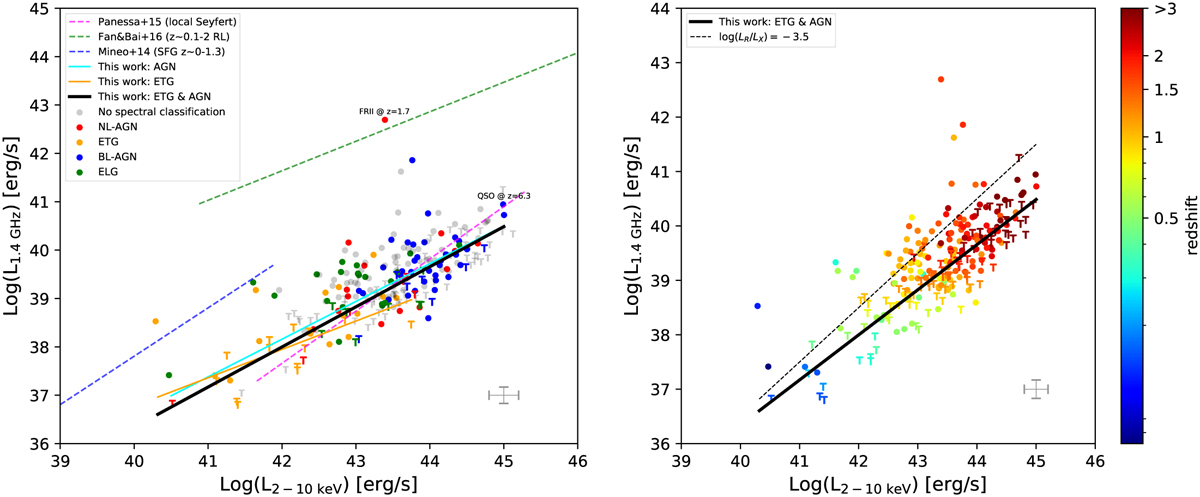
X-ray intrinsic luminosity in the 2–10 keV band versus rest frame 1.4 GHz radio luminosity for our sample. Left: Sources are color-coded by the source type. NL-AGN, BL-AGN, ETG and ELG are indicated by blue, red, orange and green symbols, respectively. The light-gray symbols mark the sources without a spectroscopic classification. Circles mare the radio detected sources, while ⊤ mark the 3σ upper limits for the undetected ones. Notable sources, that are the z = 6.3 QSO and the z = 1.7 FRII galaxy, are labeled in the figure. The solid orange, cyan and black lines are the correlations found in this work for ETG, AGN and combined ETG/AGN samples, respectively. The dashed magenta line is the Panessa et al. (2015) correlation found for local Seyfert galaxies (slope ~1.1), while the blue dashed line is the relation for 0 ≲ z ≲ 1.3 SFGs (Mineo et al. 2014). The dashed green line is the relation found for z ~ 0.1−2 RL AGN by Fan & Bai (2016). All the relations are plotted in the X-ray luminosity range in which they have been derived. Typical uncertainties on the radio (X-ray) luminosity is indicated by the vertical (horizontal) error bar in the bottom-right corner. Right: same as left panel, except that sources are color coded by their redshift (right color-bar). Here we only show the correlation we derived for the combined ETG/AGN sample (black solid line). The black dashed line marks the log(LR/LX) = −3.5 relation, set as the threshold between RL and RQ AGN (see text).
Current usage metrics show cumulative count of Article Views (full-text article views including HTML views, PDF and ePub downloads, according to the available data) and Abstracts Views on Vision4Press platform.
Data correspond to usage on the plateform after 2015. The current usage metrics is available 48-96 hours after online publication and is updated daily on week days.
Initial download of the metrics may take a while.