Fig. 12
Download original image
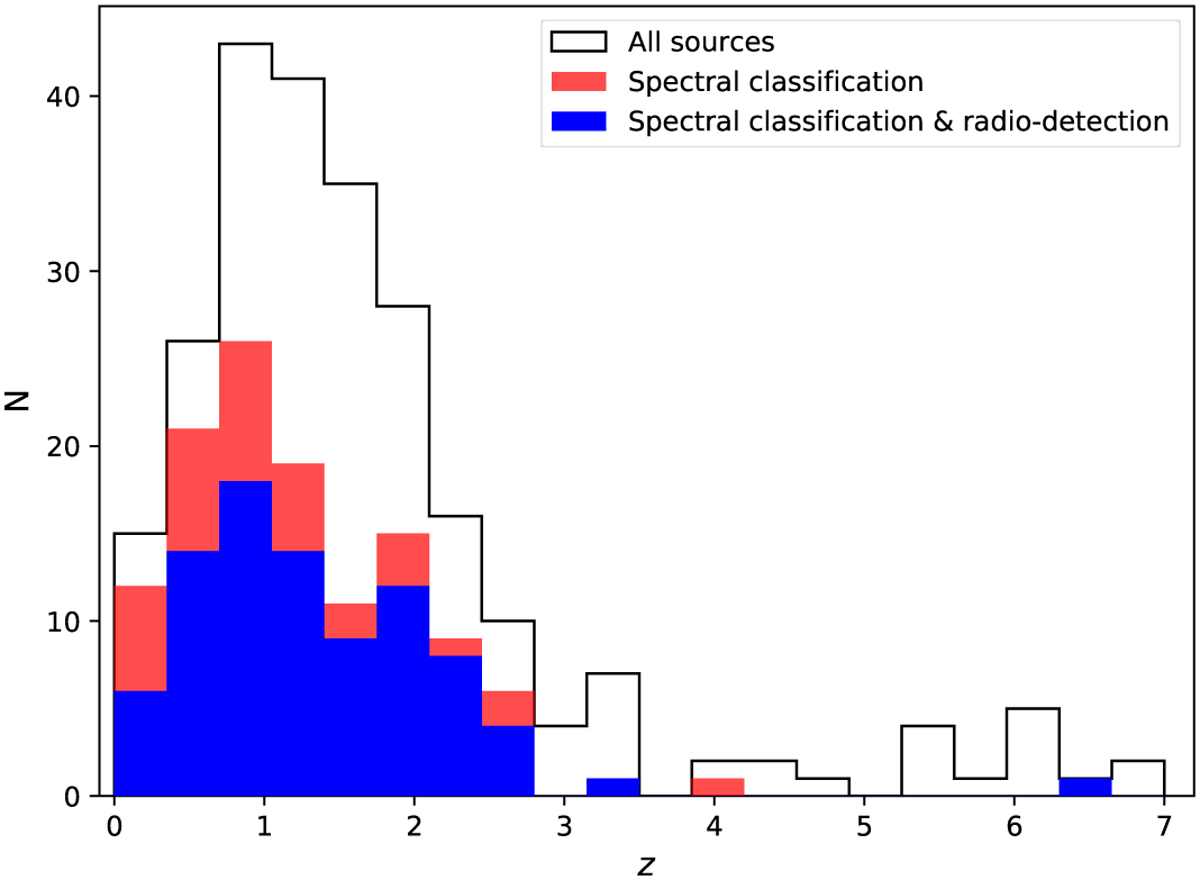
Redshift distribution of the 243 X-ray sources (black solid line) analyzed by Marchesi et al. (2021), in redshift bins of 0.35. The distribution of the 123 sources with spectroscopic redshift is indicated by the filled red histogram. The filled blue histogram highlights the distribution of those, among the latter, with a radio counterpart.
Current usage metrics show cumulative count of Article Views (full-text article views including HTML views, PDF and ePub downloads, according to the available data) and Abstracts Views on Vision4Press platform.
Data correspond to usage on the plateform after 2015. The current usage metrics is available 48-96 hours after online publication and is updated daily on week days.
Initial download of the metrics may take a while.