Fig. 11
Download original image
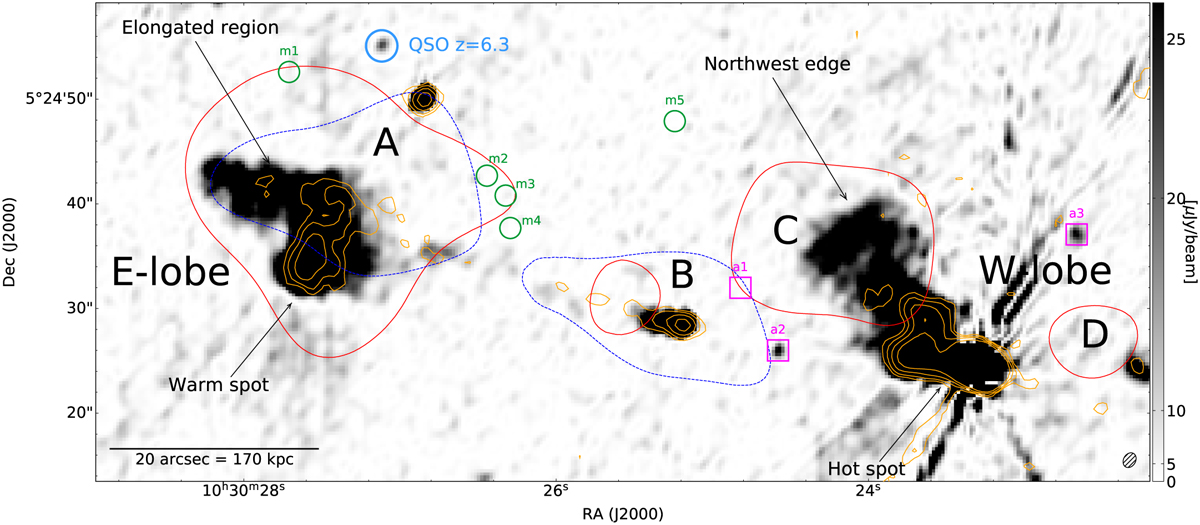
Cut-out of the 1.34 GHz JVLA image centered on the HzRG at z = 1.7. The VLA contours at 1.4 GHz (Petric et al. 2003; Nanni et al. 2018) are reported in orange, starting from a 3σ threshold and increasing with a ![]() geometric progression. Blue and red contours are the ~2σ hard and soft X-ray diffuse emission, respectively. The four major components of such emission are labeled in black (A, B, C and D). The positions of five of protocluster members discovered by MUSE (m1 − m5) are indicated by the green circles (a sixth source is located outside the cut-out, ~45 arcsec northeast from the FRII galaxy core). The positions of the protocluster members discovered by ALMA (a1−a3) are marked by the magenta boxes. The eastern and western lobes are labeled as E-lobe and W-lobe, respectively. The main morphological features of the lobes are also reported, indicated by the black arrows. Radial features originating from the western hot-spot are due to residual phase errors. The light blue circle indicates the z = 6.3 QSO at the center of the J1030 field. The solid black line at the bottom-left corner indicates the angular and physical scale, while the dashed ellipse at the bottom-right corner is the restoring beam of the JVLA image.
geometric progression. Blue and red contours are the ~2σ hard and soft X-ray diffuse emission, respectively. The four major components of such emission are labeled in black (A, B, C and D). The positions of five of protocluster members discovered by MUSE (m1 − m5) are indicated by the green circles (a sixth source is located outside the cut-out, ~45 arcsec northeast from the FRII galaxy core). The positions of the protocluster members discovered by ALMA (a1−a3) are marked by the magenta boxes. The eastern and western lobes are labeled as E-lobe and W-lobe, respectively. The main morphological features of the lobes are also reported, indicated by the black arrows. Radial features originating from the western hot-spot are due to residual phase errors. The light blue circle indicates the z = 6.3 QSO at the center of the J1030 field. The solid black line at the bottom-left corner indicates the angular and physical scale, while the dashed ellipse at the bottom-right corner is the restoring beam of the JVLA image.
Current usage metrics show cumulative count of Article Views (full-text article views including HTML views, PDF and ePub downloads, according to the available data) and Abstracts Views on Vision4Press platform.
Data correspond to usage on the plateform after 2015. The current usage metrics is available 48-96 hours after online publication and is updated daily on week days.
Initial download of the metrics may take a while.