Fig. 10
Download original image
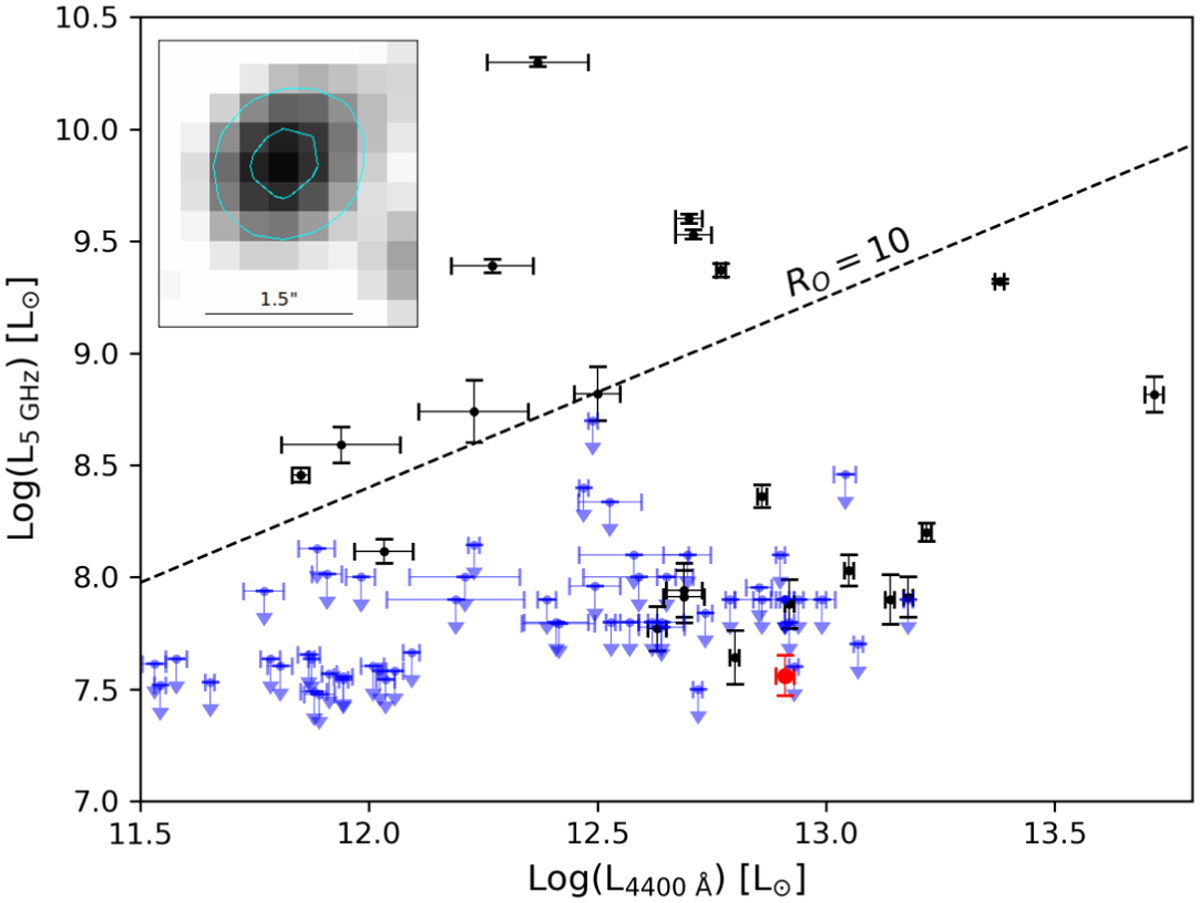
Rest-frame optical luminosity at 4400 Å versus rest-frame radio luminosity at 5 GHz for known QSOs at z≳6 (Bañados et al. 2015 and references therein; Bañados et al. 2018; Liu et al. 2021; Sbarrato et al. 2021). Black points mark radio detected sources, while blue points indicate radio undetected ones, for which 3σ upper limits are reported. The red point marks the position of the SDSS J1030+0524 QSO, based on our JVLA detection. The black dashed line indicates the radio loudness value RO = 10, set as a threshold between RQ and RL AGN (Jiang et al. 2007). The inset shows a JVLA image cutout of the z = 6.3 QSO, with cyan contours starting at 3σ and increasing with a geometric progression of ![]() . The black bar indicates the angular scale of the image.
. The black bar indicates the angular scale of the image.
Current usage metrics show cumulative count of Article Views (full-text article views including HTML views, PDF and ePub downloads, according to the available data) and Abstracts Views on Vision4Press platform.
Data correspond to usage on the plateform after 2015. The current usage metrics is available 48-96 hours after online publication and is updated daily on week days.
Initial download of the metrics may take a while.