Fig. 8.
Download original image
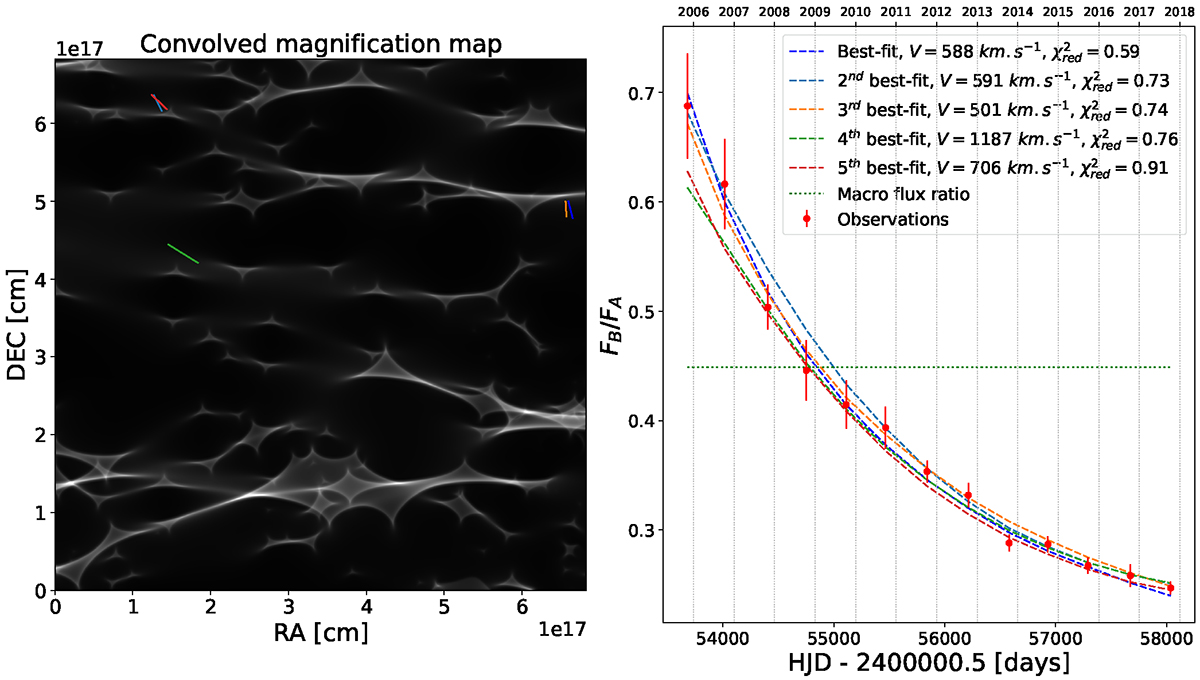
Modelling of the long-term flux ratio variations from realistic microlensing simulations. Left panel: magnification map, convolved by a thin-disk light profile with R0 = 7.9 × 1014 cm (0.3 light-days). The five best-fit trajectories are shown in colours. Right panel: observed flux ratios FB/FA of the two lensed images. The observations are averaged by season in order to fit only the long-term variations, attributed to the displacement of the quasar through the micro-caustic network. The five best-fit trajectories are shown as dashed lines. The horizontal dotted line corresponds to the flux ratio expected from the macro lens model. The legend indicates the total transverse velocity, V, corresponding to the selected trajectory as well as the associated reduced χ2 of the fit.
Current usage metrics show cumulative count of Article Views (full-text article views including HTML views, PDF and ePub downloads, according to the available data) and Abstracts Views on Vision4Press platform.
Data correspond to usage on the plateform after 2015. The current usage metrics is available 48-96 hours after online publication and is updated daily on week days.
Initial download of the metrics may take a while.