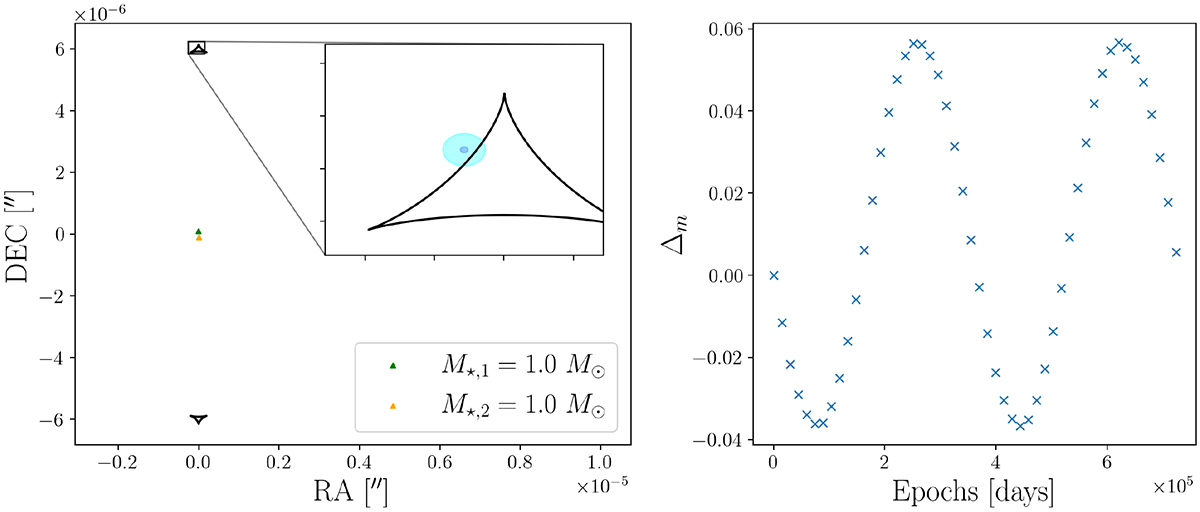
Fig. 5.
Download original image
Simulation of the microlensing effect produced by a binary star. Left panel: source plane micro-caustics (black) created by a pair of stars located at the position of image B in the lens plane. The green and orange triangles show the stars’ locations, which are separated by 200 AU. The inset panel zooms in onto the position of the accretion disk. The light (dark) blue circle corresponds to the accretion disk size R0 (size of the ISCO, RISCO). Right panel: magnitude change of image B due to the periodic motion of the microlenses. An animated version of this figure is available online.
Current usage metrics show cumulative count of Article Views (full-text article views including HTML views, PDF and ePub downloads, according to the available data) and Abstracts Views on Vision4Press platform.
Data correspond to usage on the plateform after 2015. The current usage metrics is available 48-96 hours after online publication and is updated daily on week days.
Initial download of the metrics may take a while.