Open Access
Fig. 3.
Download original image
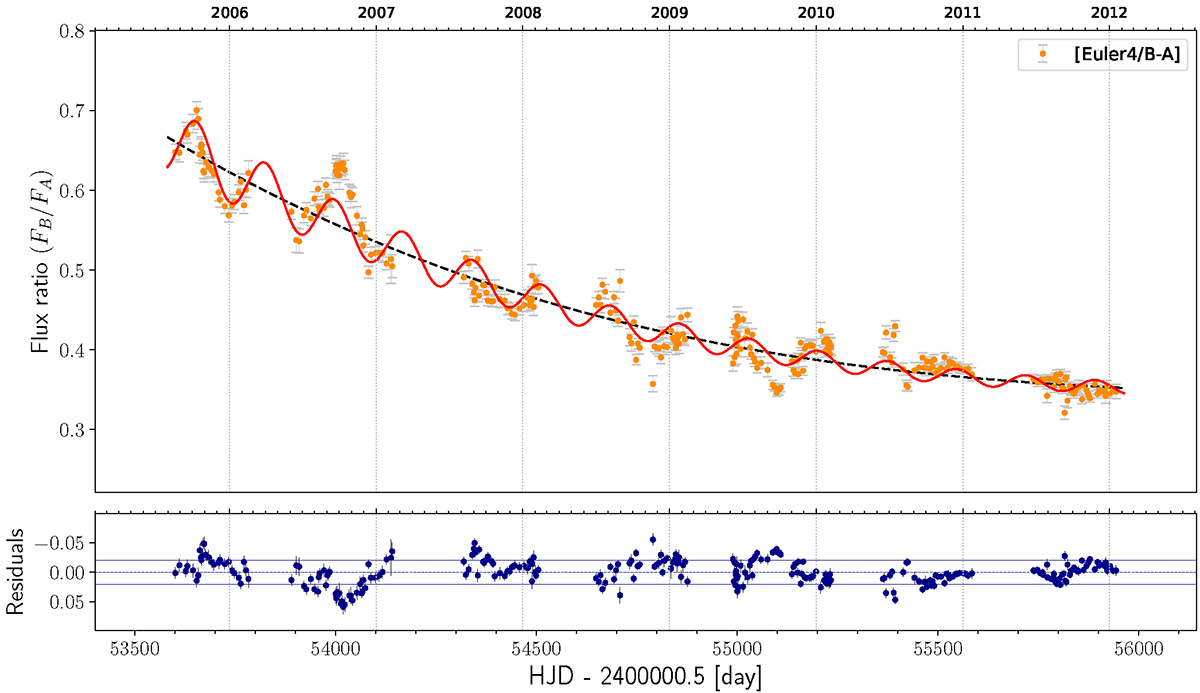
Flux ratio FB/FA as observed by the Euler telescope over the period 2005–2012. The solid red line shows our best-fit model. The dashed black line shows the smooth polynomial model representing the slow microlensing variations.
Current usage metrics show cumulative count of Article Views (full-text article views including HTML views, PDF and ePub downloads, according to the available data) and Abstracts Views on Vision4Press platform.
Data correspond to usage on the plateform after 2015. The current usage metrics is available 48-96 hours after online publication and is updated daily on week days.
Initial download of the metrics may take a while.