Fig. A.3.
Download original image
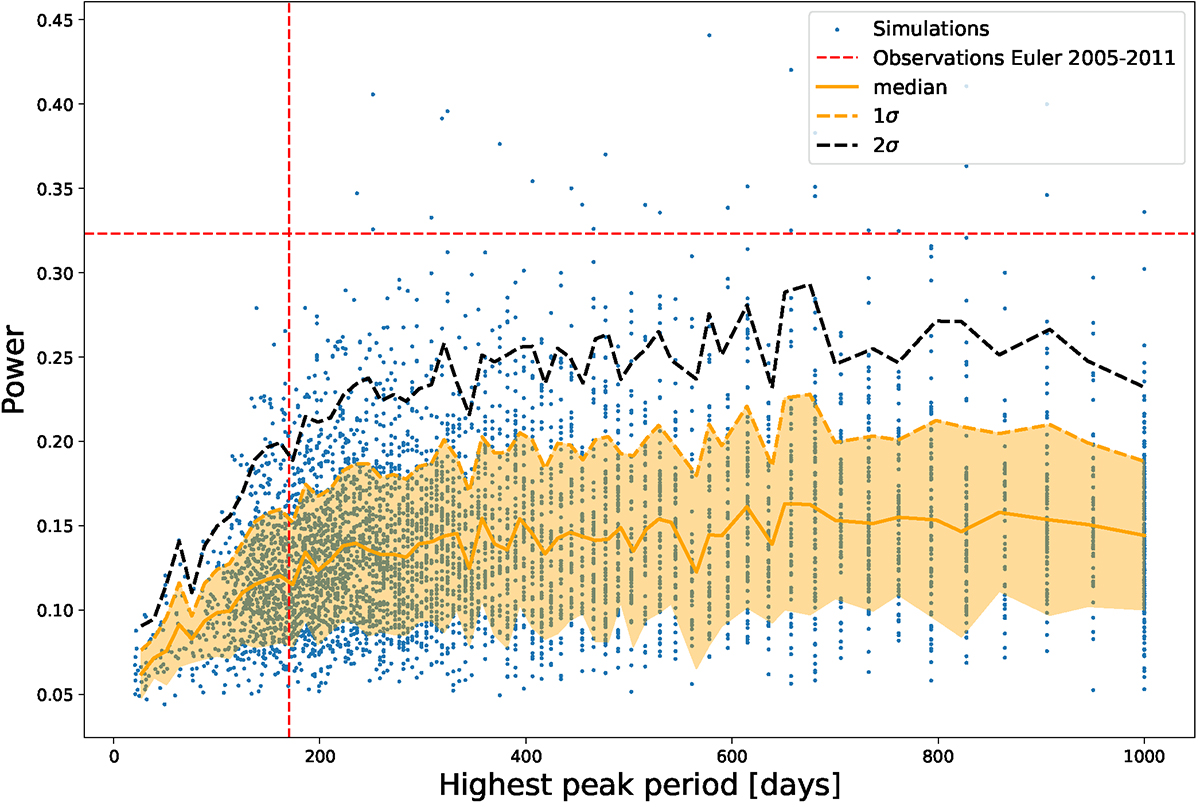
Power of the highest peak in the GLS periodogram as a function of the peak period for 5000 simulated microlensing curves. The highest peak power and the period observed in the Euler data over the period 2005-2011 are indicated as dashed red lines. The 1σ (dashed orange line) and 2σ level (dashed black line) are computed in 80 different period bins of width 18.5 days.
Current usage metrics show cumulative count of Article Views (full-text article views including HTML views, PDF and ePub downloads, according to the available data) and Abstracts Views on Vision4Press platform.
Data correspond to usage on the plateform after 2015. The current usage metrics is available 48-96 hours after online publication and is updated daily on week days.
Initial download of the metrics may take a while.