Fig. 1.
Download original image
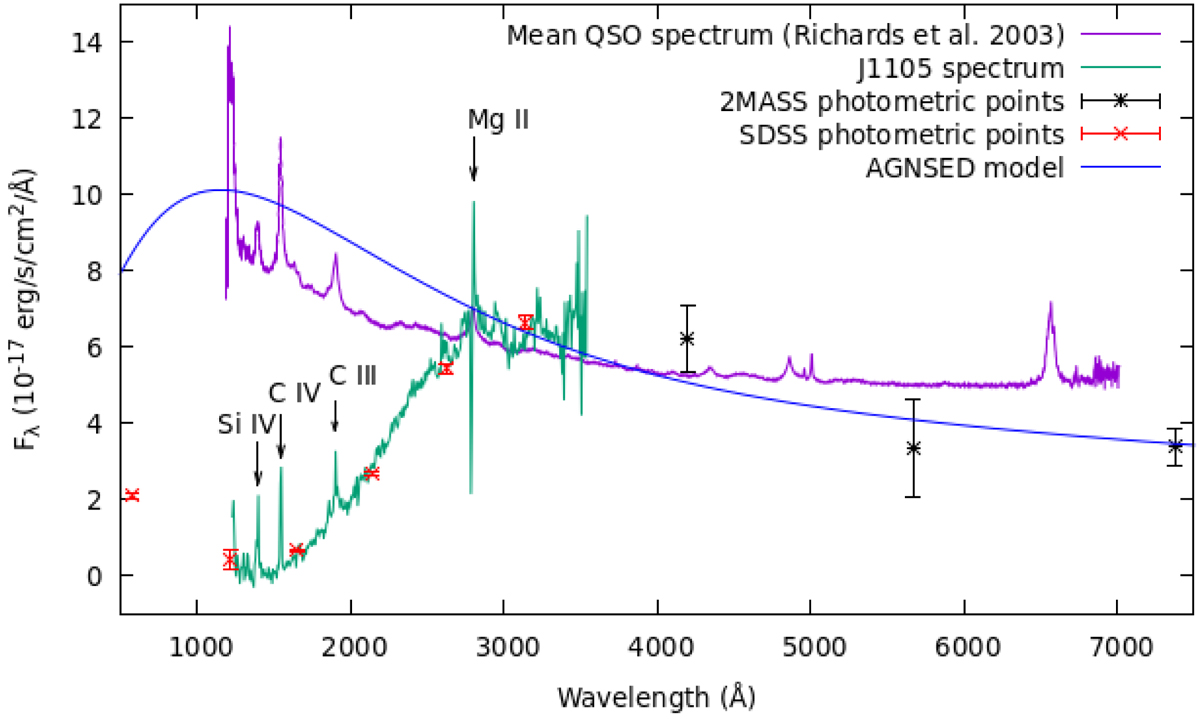
J1105 spectrum in the SDSS Data Release 14 (green line) in comparison with the mean QSO spectrum (purple line) by Richards et al. (2003). Both spectra were correlated regarding the Mg II line. In addition, we present earlier photometric points by the SDSS (Adelman-McCarthy et al. 2008) and 2MASS (Skrutskie et al. 2006) surveys, and the final broadband fit model is shown with the blue line.
Current usage metrics show cumulative count of Article Views (full-text article views including HTML views, PDF and ePub downloads, according to the available data) and Abstracts Views on Vision4Press platform.
Data correspond to usage on the plateform after 2015. The current usage metrics is available 48-96 hours after online publication and is updated daily on week days.
Initial download of the metrics may take a while.