Fig. 9
Download original image
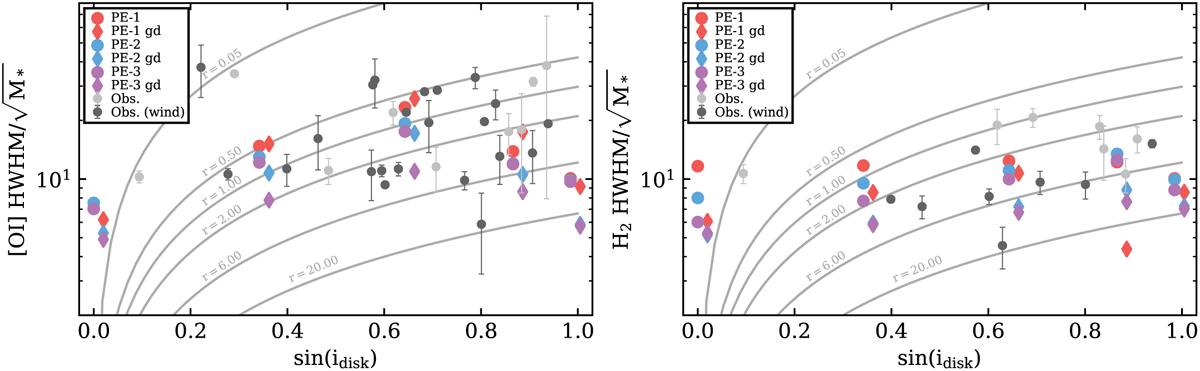
HWHM (left panel: [OI], right panel H2) scaled by the square root of the stellar mass as a function of inclination. The coloured symbols show the models; the gd models (diamonds) are slightly shifted along the inclination axis for clarity. The black (grey) symbols show the observations, where the black coloured symbols mark the targets that show blueshifted peaks in the respective line profile. The solid lines show the maximum emission radius RK derived for the given HWHM and inclination assuming Keplerian rotation for a thin disk (see Eq. (1)).
Current usage metrics show cumulative count of Article Views (full-text article views including HTML views, PDF and ePub downloads, according to the available data) and Abstracts Views on Vision4Press platform.
Data correspond to usage on the plateform after 2015. The current usage metrics is available 48-96 hours after online publication and is updated daily on week days.
Initial download of the metrics may take a while.