Fig. 7

Download original image
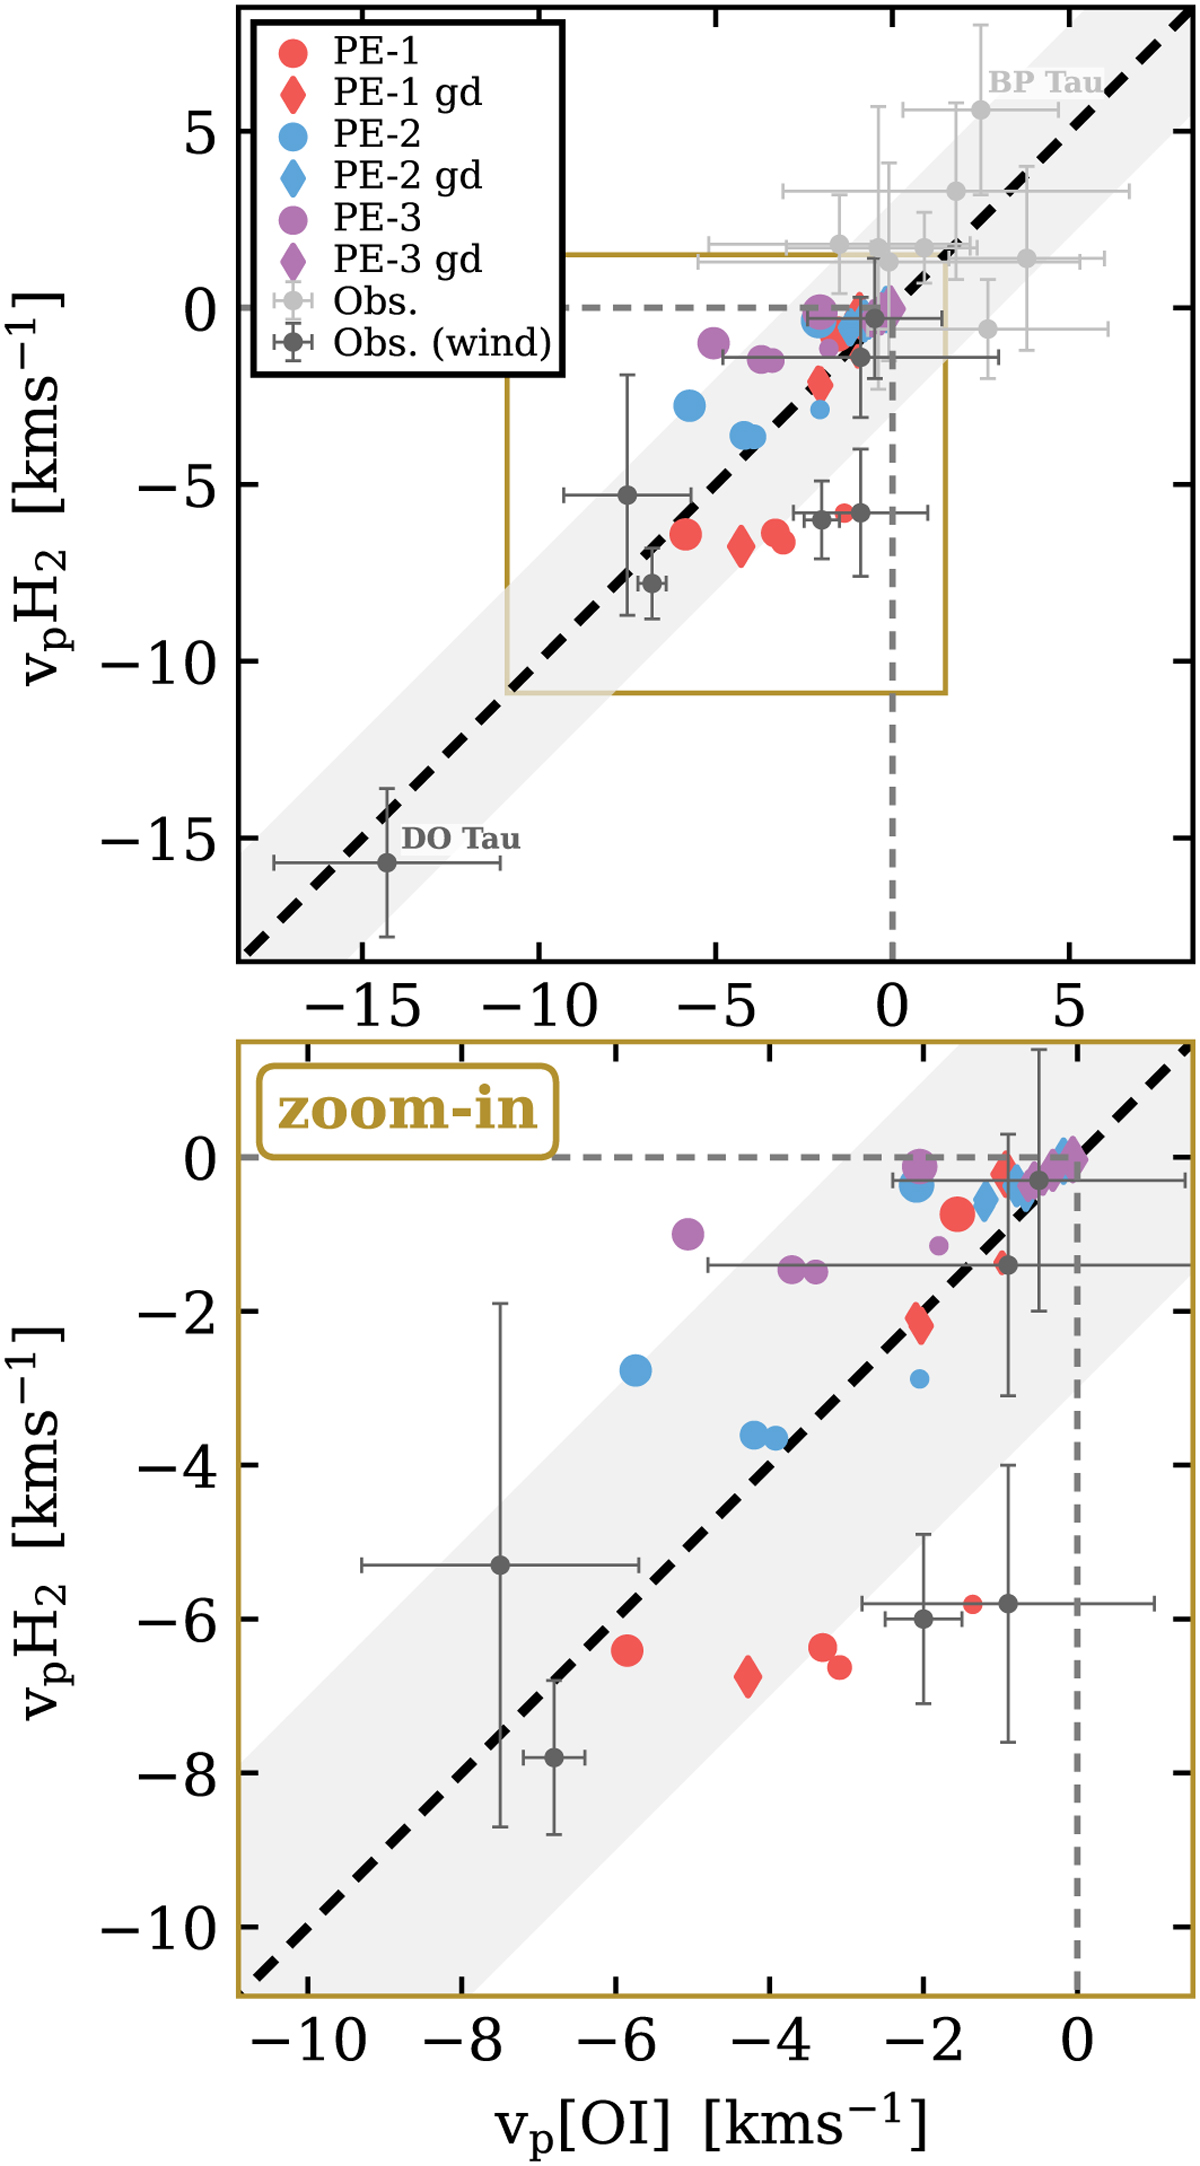
Velocity peak location vp of o–H2 2.12 µm vs vp [OI] 0.63 µm. Filled circles with error bars show the observed values; the black colour is for targets with vp < 0 km s−1 (i.e. blue-shifted wind component) for both the o–H2 2.12 µm and [OI] 0.63 µm; light-grey marks targets with vp > 0 km s−1 (i.e. no clear indication of a disk wind). The coloured symbols are for the models. Shown are models for the three different accretion luminosities and with a reduced dust-to-gas mass ratio in the wind (coloured diamonds). The size of the coloured symbols scales with the inclination; smallest symbols are for i = 0° largest are for i = 80°. The thick dashed line indicates vpH2 = vp[OI] and the light grey stripe indicates vpH2 = vp[OI] ± 3 km s−1. Top panel: all data points; bottom panel: zoom-in (brown box) showing all the models and the observational data for targets with clear wind signatures, excluding DO Tau.
Current usage metrics show cumulative count of Article Views (full-text article views including HTML views, PDF and ePub downloads, according to the available data) and Abstracts Views on Vision4Press platform.
Data correspond to usage on the plateform after 2015. The current usage metrics is available 48-96 hours after online publication and is updated daily on week days.
Initial download of the metrics may take a while.


