Fig. 6
Download original image
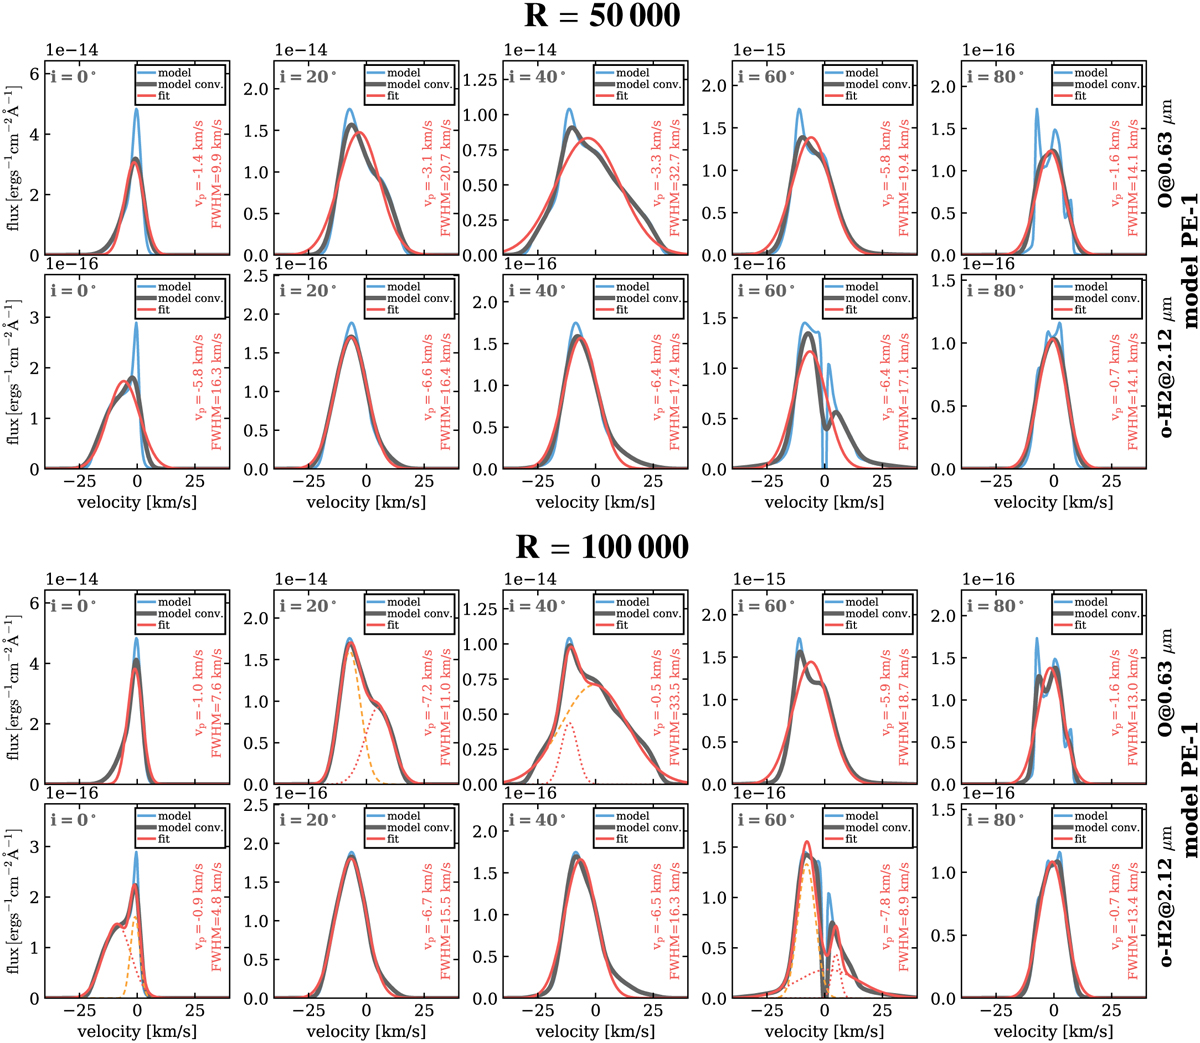
Example of the line-fitting results for the PE-1 model. The top figure shows the results for a spectral resolution R = 50 000 (i.e. similar to the observations). The bottom figure shows the same model, but the line profiles were convolved to a spectral resolution of R = 100 000 (see Sects. 4.1.1 and 4.1.4). Each individual panel shows the line profile with the model resolution (blue), convolved to the target spectral resolution (black) and the Gaussian fit (the NLVC) to the convolved profile (red solid line). In case of multiple Gaussians (dashed and dotted lines), the orange dashed line indicates the one chosen as the NLVC. This component is used to determine vp and the FWHM (also given in each panel). The fitting results for all other models are shown in Appendix F.
Current usage metrics show cumulative count of Article Views (full-text article views including HTML views, PDF and ePub downloads, according to the available data) and Abstracts Views on Vision4Press platform.
Data correspond to usage on the plateform after 2015. The current usage metrics is available 48-96 hours after online publication and is updated daily on week days.
Initial download of the metrics may take a while.