Fig. 5
Download original image
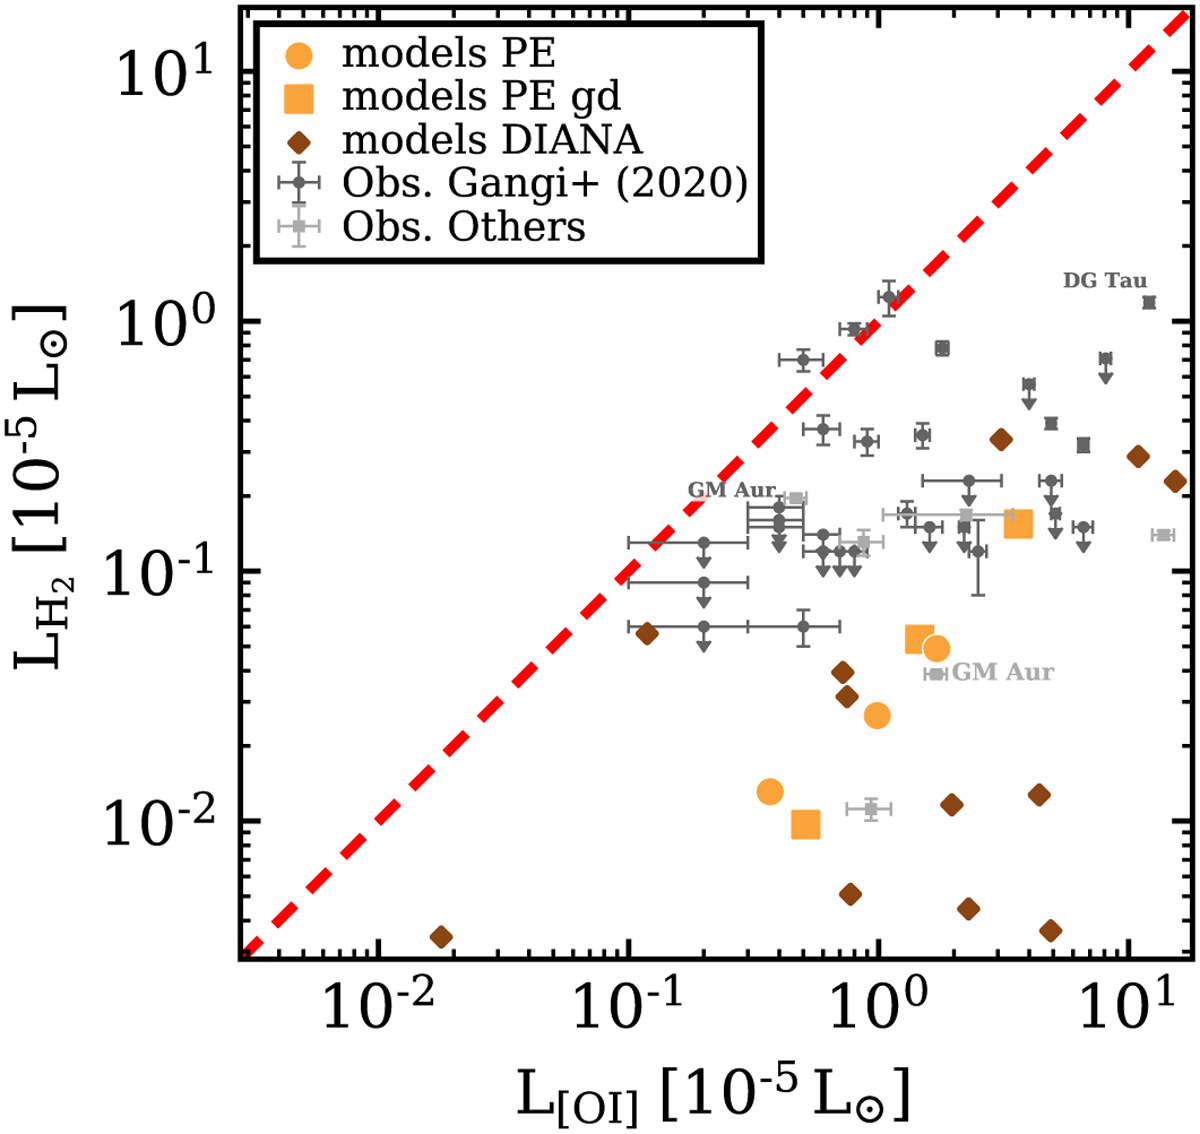
o–H2 2.12 µm versus [OI] 0.63 µm line luminosities. The dark grey points with error bars show the observations from Gangi et al. (2020, 2021), and the light-grey points show observational data collected from the literature (see Appendix D for details). The orange symbols show the photoevaporative disk-wind models (inclination i = 40°) with varying accretion luminosities (lowest(highest) line luminosities are for the lowest(highest) accretion luminosity). The square symbols are for the models with reduced dust-to-gas mass ratio in the wind. The brown diamonds are the results from the DIANA project (PRODIMO models without a wind component). We mark DG Tau as an example of a target that likely cannot be modelled with a pure photoevaporative wind. We also mark the two independent observations for GM Aur (see Appendix D).
Current usage metrics show cumulative count of Article Views (full-text article views including HTML views, PDF and ePub downloads, according to the available data) and Abstracts Views on Vision4Press platform.
Data correspond to usage on the plateform after 2015. The current usage metrics is available 48-96 hours after online publication and is updated daily on week days.
Initial download of the metrics may take a while.