Fig. 4
Download original image
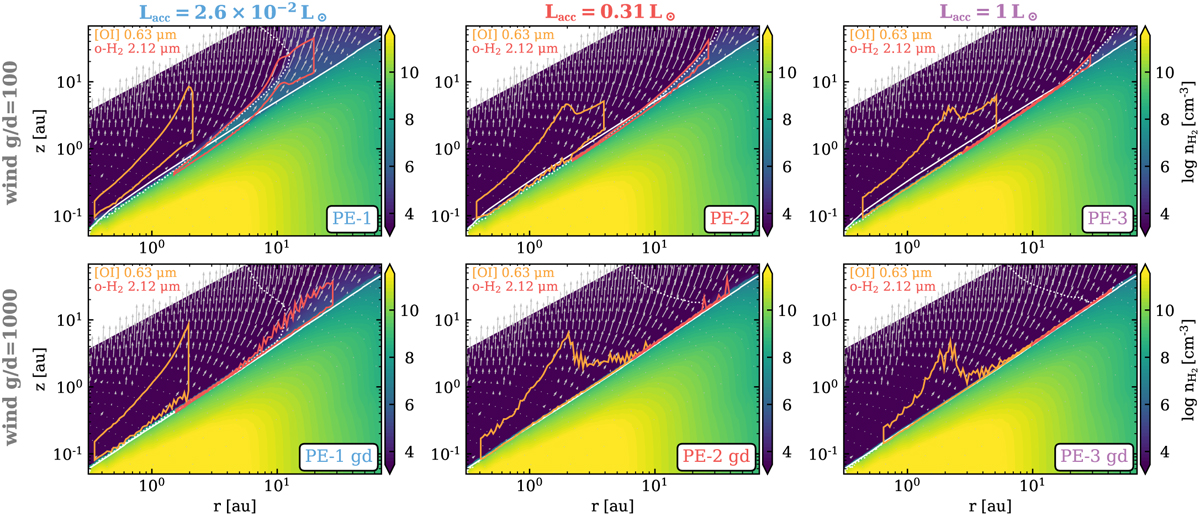
Main emitting region for the [OI] 0.63 µm (orange boxes) and o–H2 2.12 µm (red boxes) spectral lines. The columns show the three models with varying Lacc (increasing from left to right). The top row shows the models with g/d = 100 and the bottom row with g/d = 1000 in the wind. The coloured contours show the molecular hydrogen number density ![]() . The borders of the line emission boxes indicate where the total emission reaches 15% and 75% in the radial (integrated inside-out) and vertical (integrated from top to bottom) directions. The solid white line shows where the radial visual extinction AV,rad reaches unity, and the white dotted line Tgas = 1000 K. The grey arrows indicate the 2D velocity field (vertical and radial components of the wind).
. The borders of the line emission boxes indicate where the total emission reaches 15% and 75% in the radial (integrated inside-out) and vertical (integrated from top to bottom) directions. The solid white line shows where the radial visual extinction AV,rad reaches unity, and the white dotted line Tgas = 1000 K. The grey arrows indicate the 2D velocity field (vertical and radial components of the wind).
Current usage metrics show cumulative count of Article Views (full-text article views including HTML views, PDF and ePub downloads, according to the available data) and Abstracts Views on Vision4Press platform.
Data correspond to usage on the plateform after 2015. The current usage metrics is available 48-96 hours after online publication and is updated daily on week days.
Initial download of the metrics may take a while.