Fig. F.1
Download original image
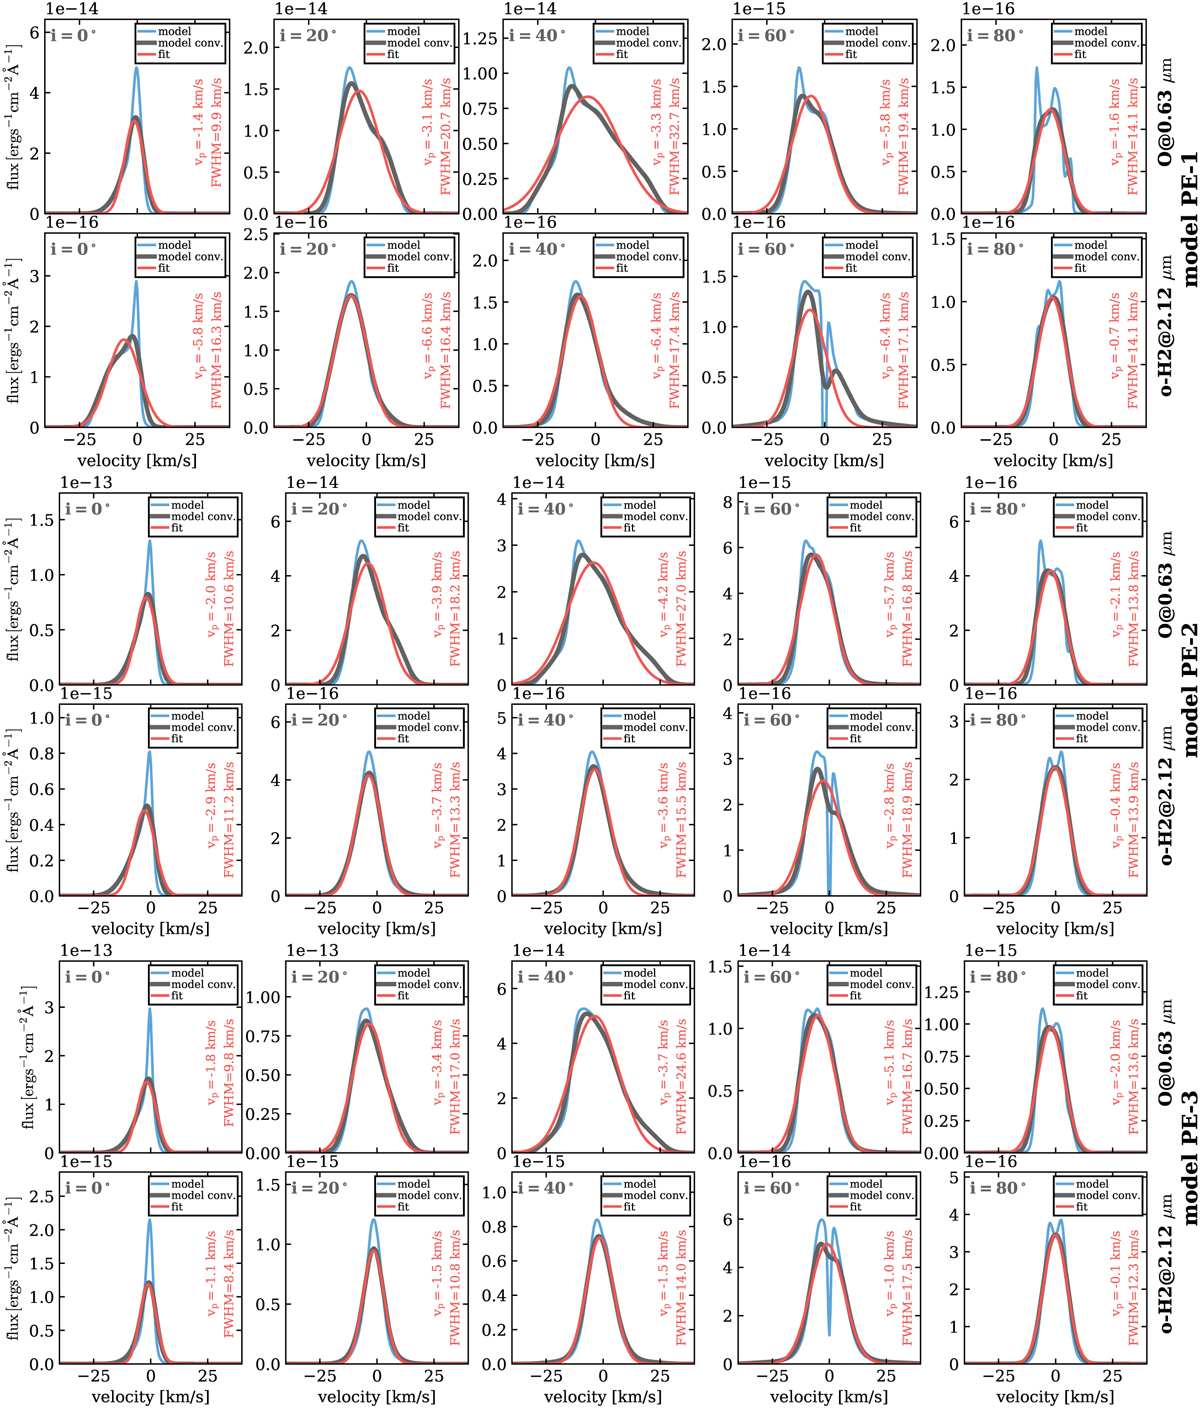
Fitting of the modelled line profiles. From top to bottom, the models PE-1, PE-2, and PE-3 are shown. Please note the different scaling on the y axis (flux) for each panel. For each model, we show the [OI] 0.63 µm (first row) and the o–H2 2.12 µm (second row) for five different inclinations (columns from left to right). Each panel shows the line profile with the model resolution (blue) convolved to a resolution of R = 50000 similar to the observations (black), and the fit (the NLVC) to the convolved profile (red solid line).
Current usage metrics show cumulative count of Article Views (full-text article views including HTML views, PDF and ePub downloads, according to the available data) and Abstracts Views on Vision4Press platform.
Data correspond to usage on the plateform after 2015. The current usage metrics is available 48-96 hours after online publication and is updated daily on week days.
Initial download of the metrics may take a while.