Open Access
Fig. B.1
Download original image
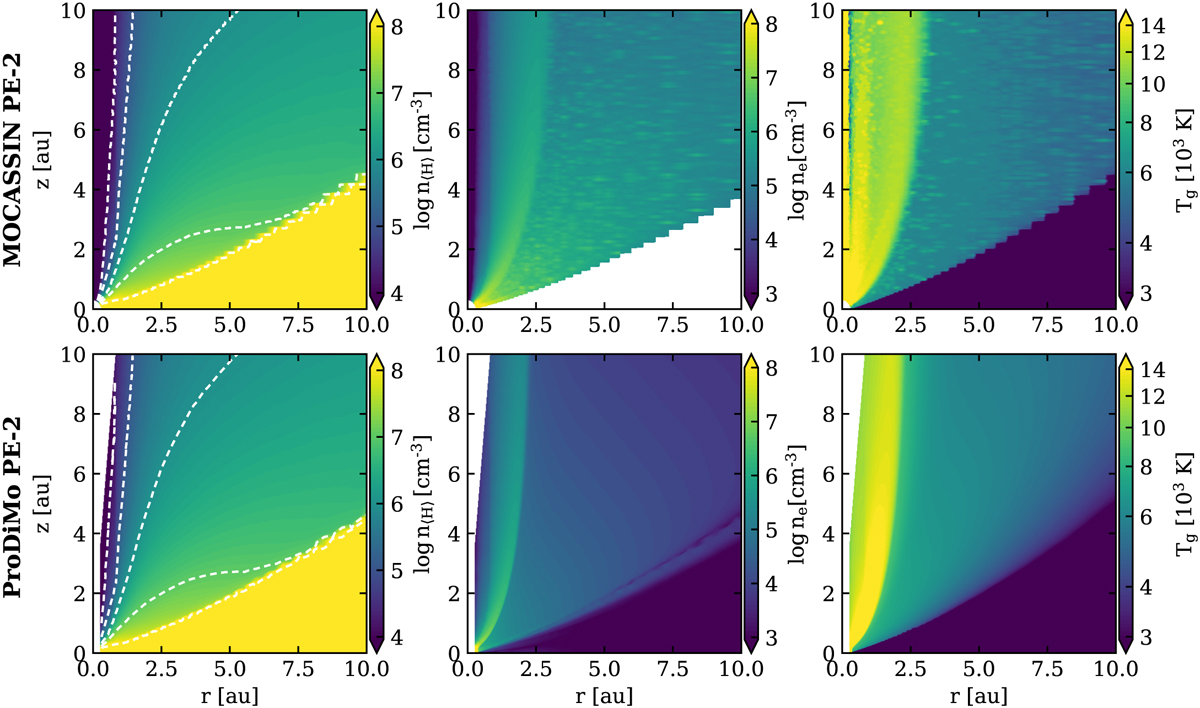
Comparison of the MOCASSIN and PRODIMO model. The first row shows the MOCASSIN model, the bottom row the PRODIMO model. From left to right the 2D structure of the hydrogen density (as reference, identical in both models), electron density and the gas temperature for the inner 10 au are shown.
Current usage metrics show cumulative count of Article Views (full-text article views including HTML views, PDF and ePub downloads, according to the available data) and Abstracts Views on Vision4Press platform.
Data correspond to usage on the plateform after 2015. The current usage metrics is available 48-96 hours after online publication and is updated daily on week days.
Initial download of the metrics may take a while.