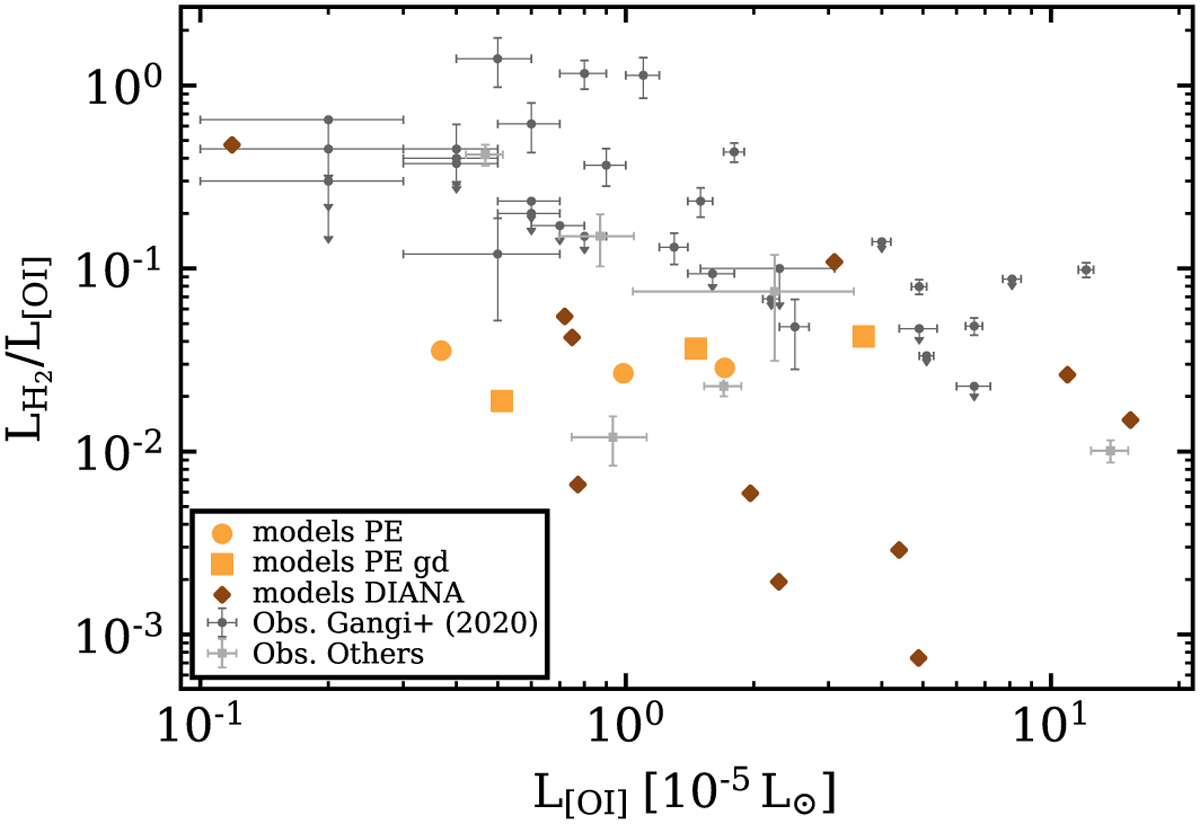
Fig. 13
Download original image
Line luminosity ratio of o–H2 2.12 µm and [Ol] 0.63 µm as a function of the [Ol] 0.63 µm luminosity. The observational data points and models shown are the same as in Fig. 5. We omit the one DIANA model with the lowest line luminosities for clarity. The upper limits for the line ratios (downward arrows) are a consequence of the o–H2 2.12 µm line luminosity upper limits.
Current usage metrics show cumulative count of Article Views (full-text article views including HTML views, PDF and ePub downloads, according to the available data) and Abstracts Views on Vision4Press platform.
Data correspond to usage on the plateform after 2015. The current usage metrics is available 48-96 hours after online publication and is updated daily on week days.
Initial download of the metrics may take a while.