Fig. 7.
Download original image
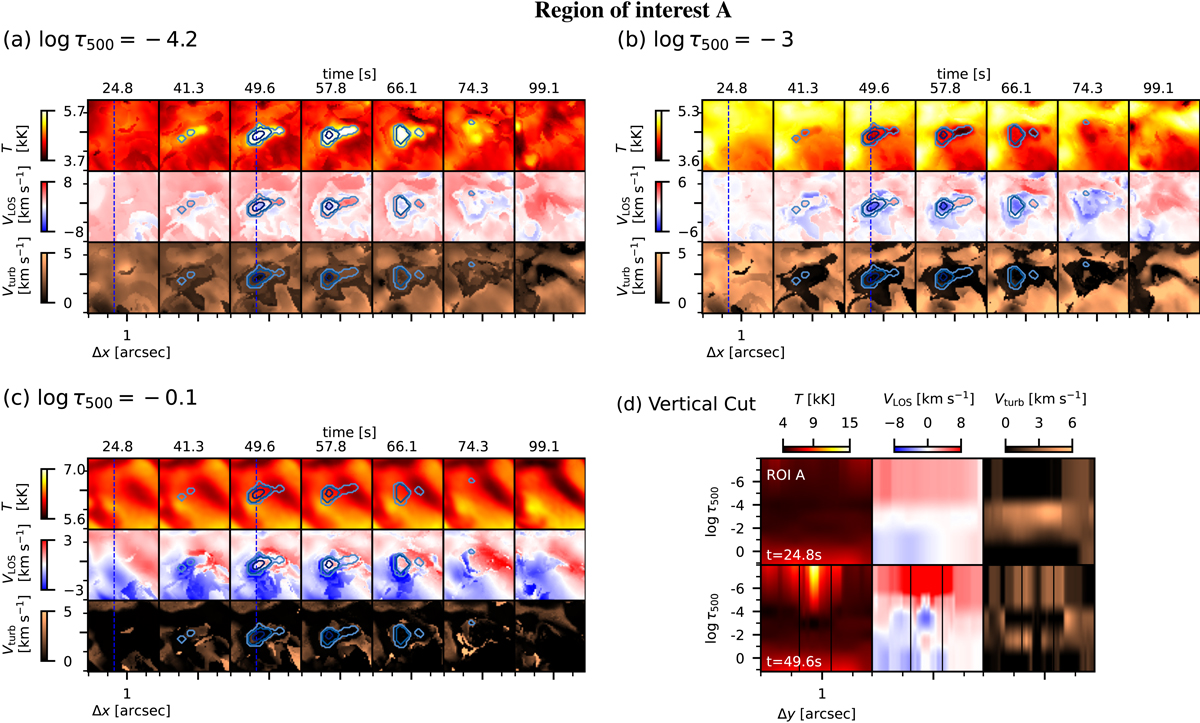
Evolution of inferred stratified atmospheric parameters from the inversions of ROI A. The parameter maps for three values of log τ500 = [−4.2, −3, and −0.1] are shown in the panels a, b, and c, respectively. The first, second, and third rows show the evolution of T, VLOS, and Vturb. Panel d shows cross cuts along the depth of the atmospheres through the y-axis for two time steps as indicated. The x positions for these cross cuts are indicated by dashed blue lines in panels a–c. The contours in each panel show the pixels classified as CBGs, as shown in Fig. 2.
Current usage metrics show cumulative count of Article Views (full-text article views including HTML views, PDF and ePub downloads, according to the available data) and Abstracts Views on Vision4Press platform.
Data correspond to usage on the plateform after 2015. The current usage metrics is available 48-96 hours after online publication and is updated daily on week days.
Initial download of the metrics may take a while.