Fig. 6.
Download original image
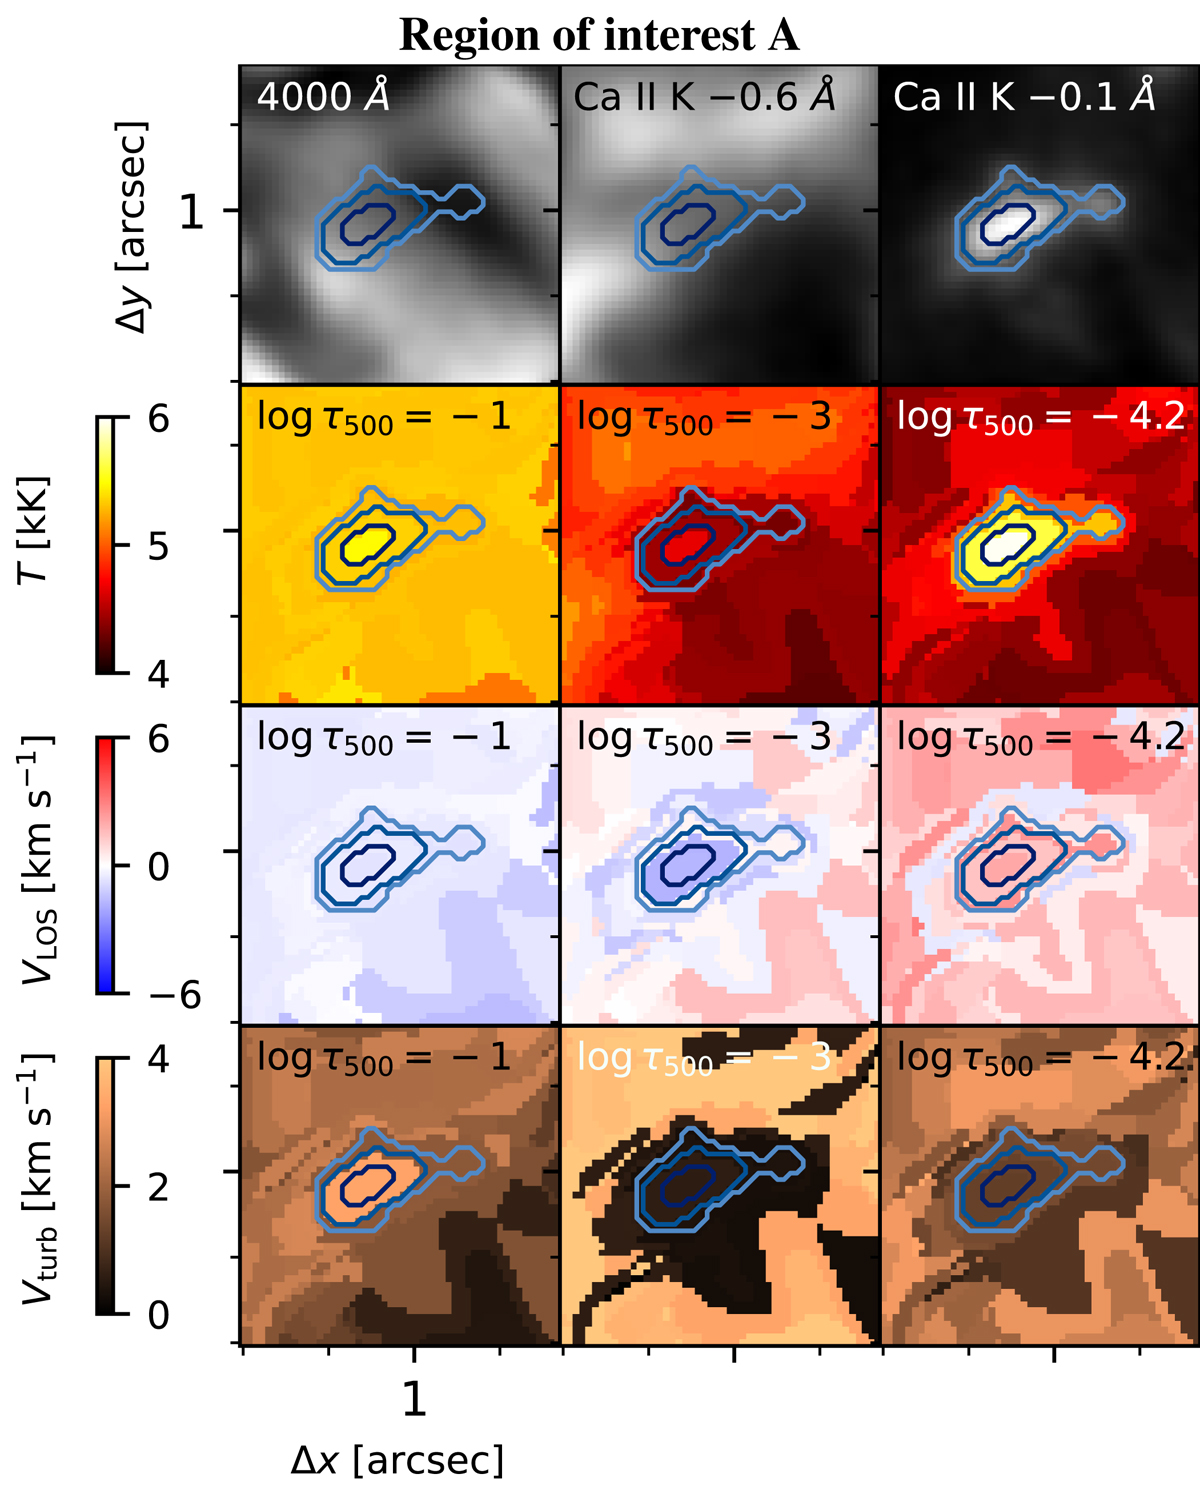
Maps of initial guess atmospheres for ROI A based on inversions of corresponding RPs. The first row shows images of the 4000 Å continuum, the Ca II K line wing image (−0.6 Å), and the line core blue wing image (−0.1 Å). The second, third, and fourth rows show values at log τ500 = −1, −3, and −4.2 of T, VLOS, and Vturb, respectively. The outer contour (cyan) is made with pixels belonging to RPs 85, 36, 18, and 78, while the middle contour (azure blue) is made with RPs 18 and 78. The inner contour (navy blue) shows the region belonging to RP 78, the strongest CBG RP.
Current usage metrics show cumulative count of Article Views (full-text article views including HTML views, PDF and ePub downloads, according to the available data) and Abstracts Views on Vision4Press platform.
Data correspond to usage on the plateform after 2015. The current usage metrics is available 48-96 hours after online publication and is updated daily on week days.
Initial download of the metrics may take a while.