Fig. 5.
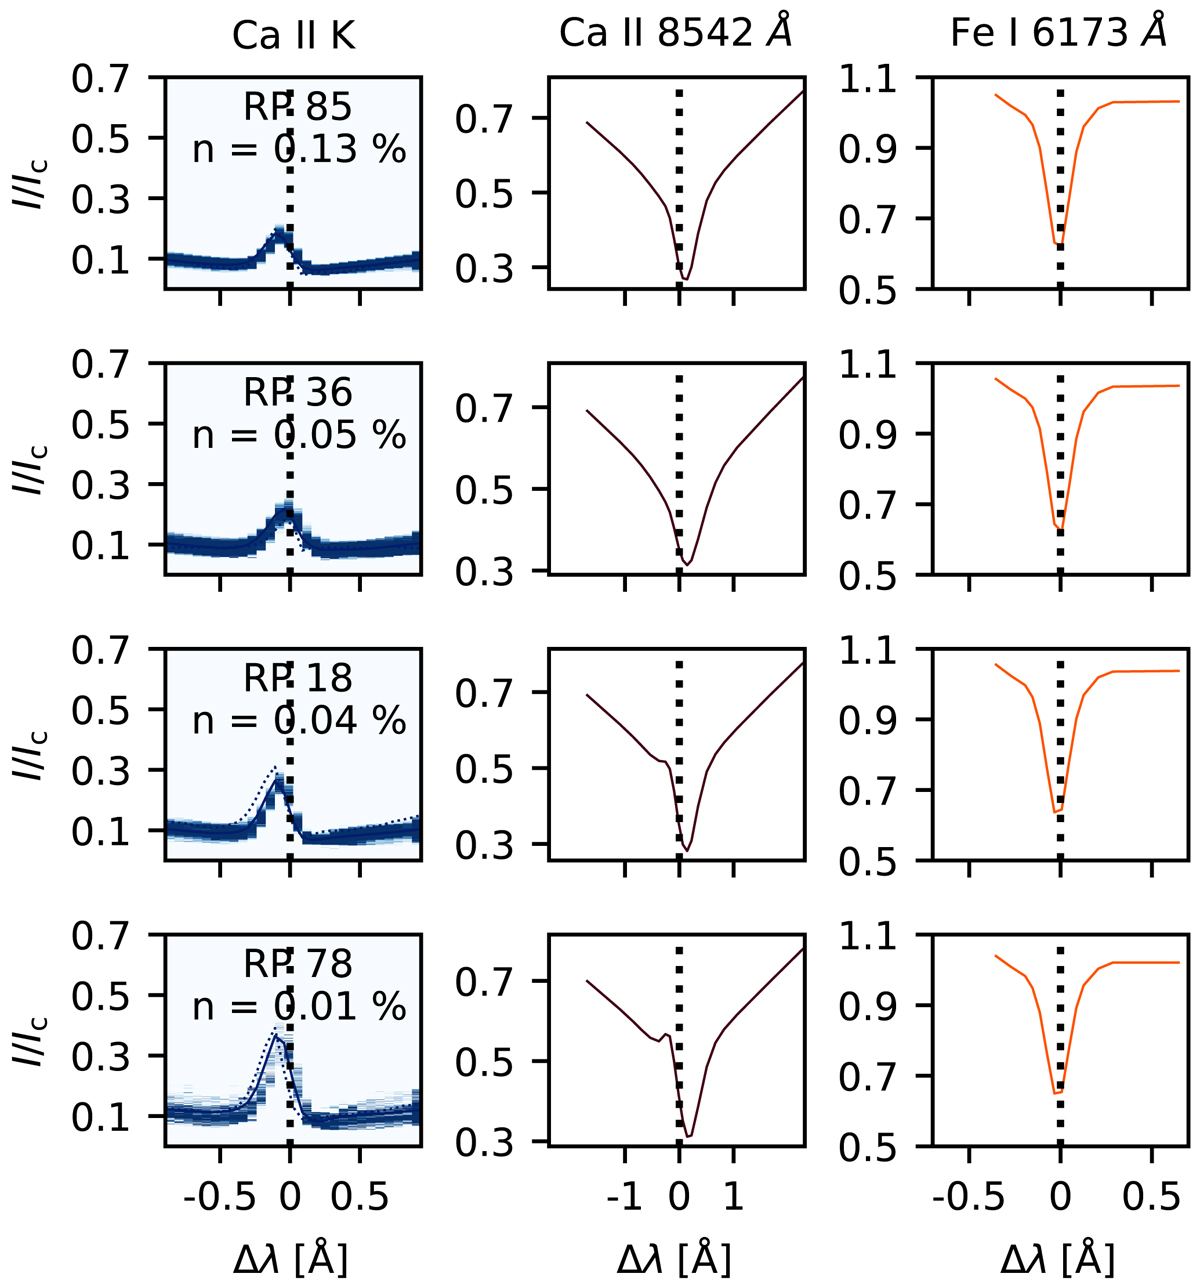
Download original image
Illustrating the efficiency of the partitioning algorithm (k-means) in CBG clusters. The RPs in the Ca II K, Ca II 8542 Å, and Fe I 6173 Å lines are shown using solid blue, maroon, and red lines, respectively. The dashed lines mark the zero position in the wavelength axis. The density distribution plots of the Ca II K spectra for four RPs classified as CBG RPs are shown in blue. The density (darker meaning a higher concentration of spectra) corresponding to each Ca II K RP shows the distribution of profiles over the entire time series. The percentage of profiles out of the whole data set belonging to a particular cluster is denoted as n.
Current usage metrics show cumulative count of Article Views (full-text article views including HTML views, PDF and ePub downloads, according to the available data) and Abstracts Views on Vision4Press platform.
Data correspond to usage on the plateform after 2015. The current usage metrics is available 48-96 hours after online publication and is updated daily on week days.
Initial download of the metrics may take a while.