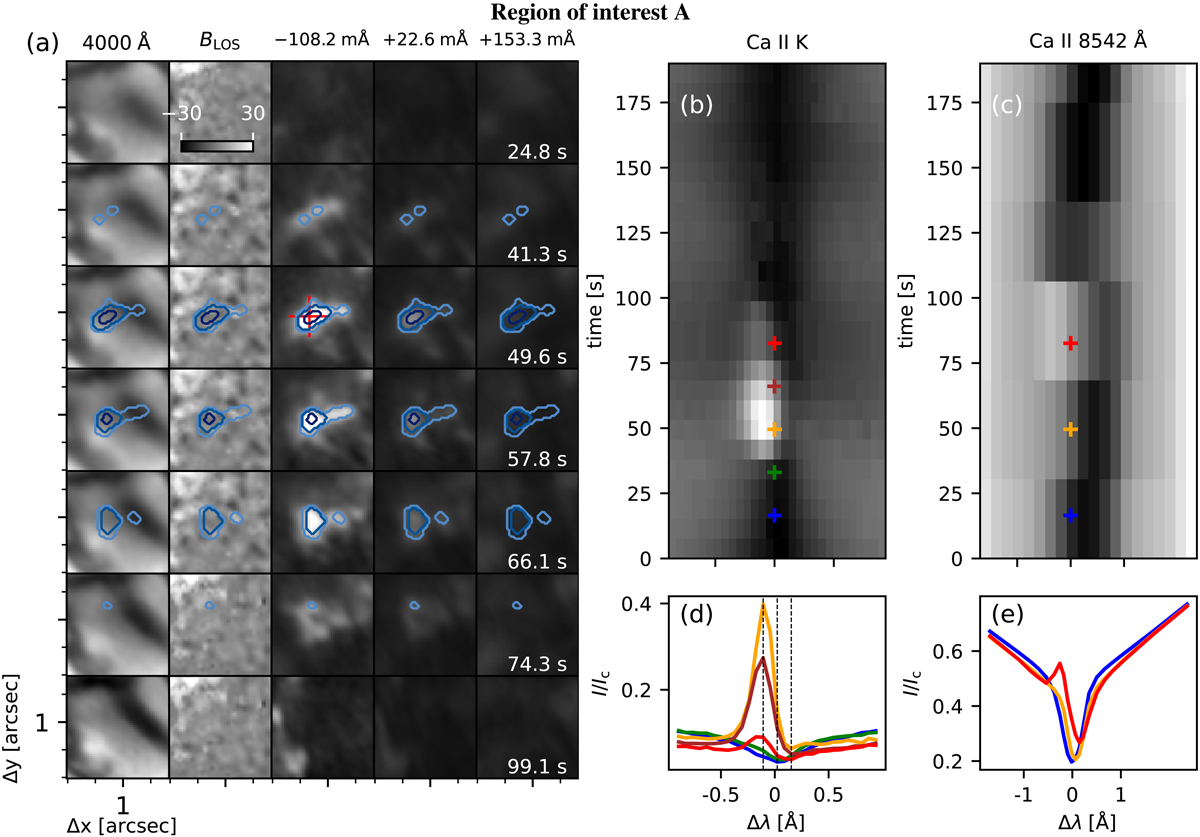
Fig. 2.
Download original image
Region of interest A: (a) The time evolution of the continuum at 4000 Å, LOS magnetic field (BLOS), and images at wavelength offsets of −108.2 mÅ, +22.6 mÅ, and +153.3 mÅ from the core of the Ca II K line are shown column-wise. Panels b and c display λ–t diagrams for the pixel marked with a “+” in panel a in the Ca II K and Ca II 8542 Å lines, respectively. A gamma correction with γ = 0.85 was applied on the Ca II K narrowband images in panel a, and γ = 0.1 on panels b and c. A few selected profiles marked in panels b and c are shown in panels d and e. The outer contour (cyan) is made with pixels belonging to RPs 85, 36, 18, and 78, while the middle contour (azure blue) is made with RPs 18 and 78 in panel a. The inner contour (navy blue) shows the region belonging to RP 78, the strongest CBG RP. The dashed vertical lines in panel d show the position of the narrowband images in panel a.
Current usage metrics show cumulative count of Article Views (full-text article views including HTML views, PDF and ePub downloads, according to the available data) and Abstracts Views on Vision4Press platform.
Data correspond to usage on the plateform after 2015. The current usage metrics is available 48-96 hours after online publication and is updated daily on week days.
Initial download of the metrics may take a while.