Fig. D.1.
Download original image
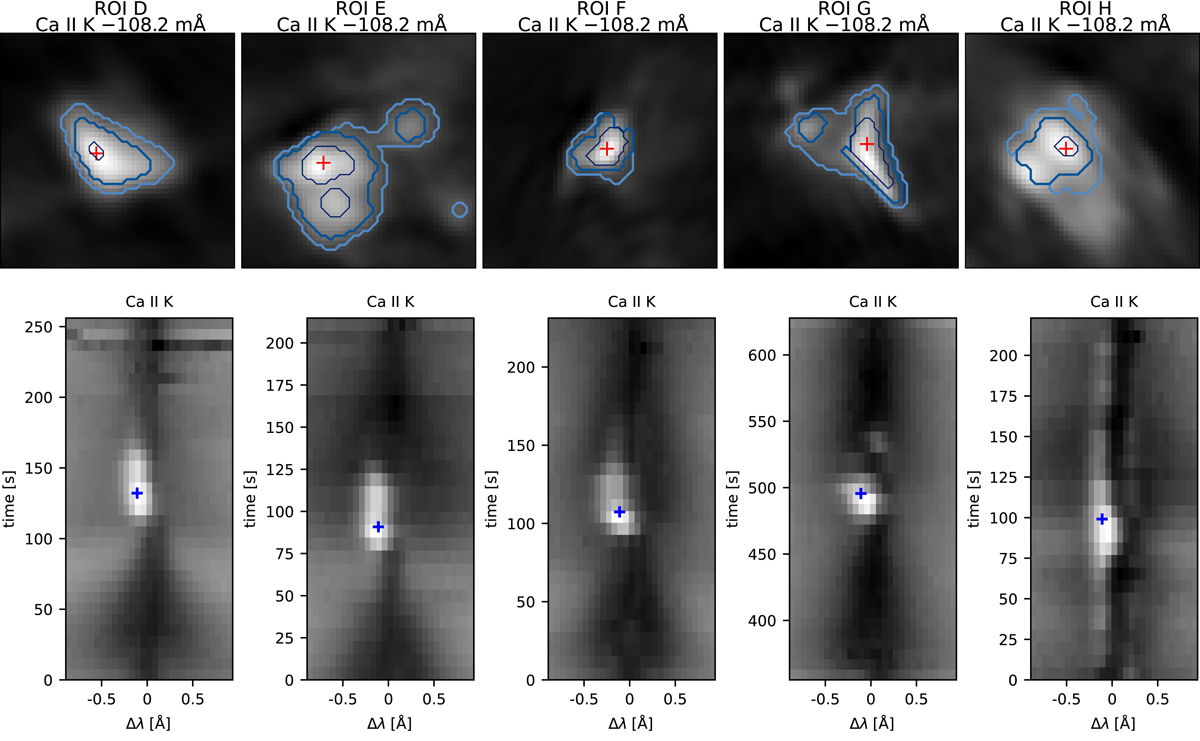
Overview of the CBGs in ROI s D–H. Panels in the top row show narrowband images at a wavelength offset of −108.2 mÅ from the Ca II K line of ROI s D-H. Panels in the bottom row show the λ–t diagram in the Ca II K line for the pixel marked with a “+” in the top row. The time step at which the narrowband images are shown in the top row are marked with a “+” in the bottom row.
Current usage metrics show cumulative count of Article Views (full-text article views including HTML views, PDF and ePub downloads, according to the available data) and Abstracts Views on Vision4Press platform.
Data correspond to usage on the plateform after 2015. The current usage metrics is available 48-96 hours after online publication and is updated daily on week days.
Initial download of the metrics may take a while.